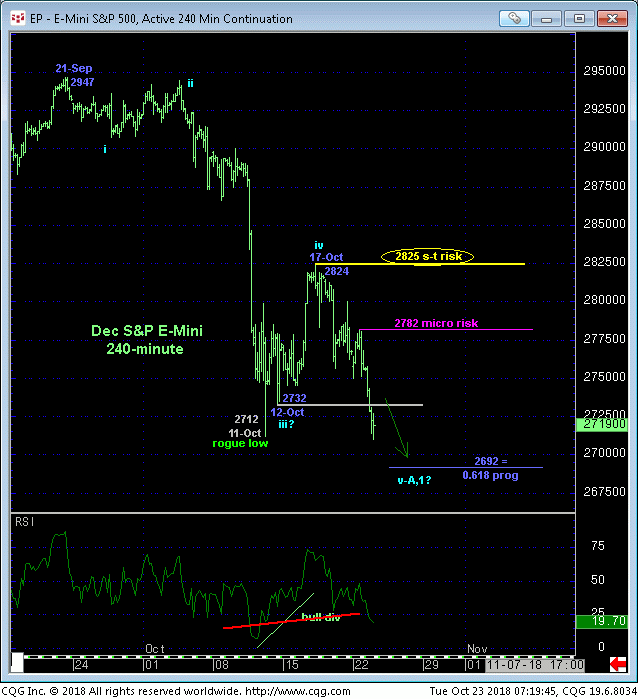
Overnight’s relapse below 12-Oct’s 2732 low reaffirms the downtrend from 21-Sep’s 2947 all-time high and leaves smaller-degree corrective highs in its wake at 2782 and 2824 the market is required to sustain losses below to maintain a more immediate bearish count. In this regard these levels represent our new micro- and short-term risk parameters from which a neutral-to-cautiously-bearish policy can be objectively rebased and managed. In lieu of a recovery above at least 2782, further and possibly accelerated losses should not surprise.


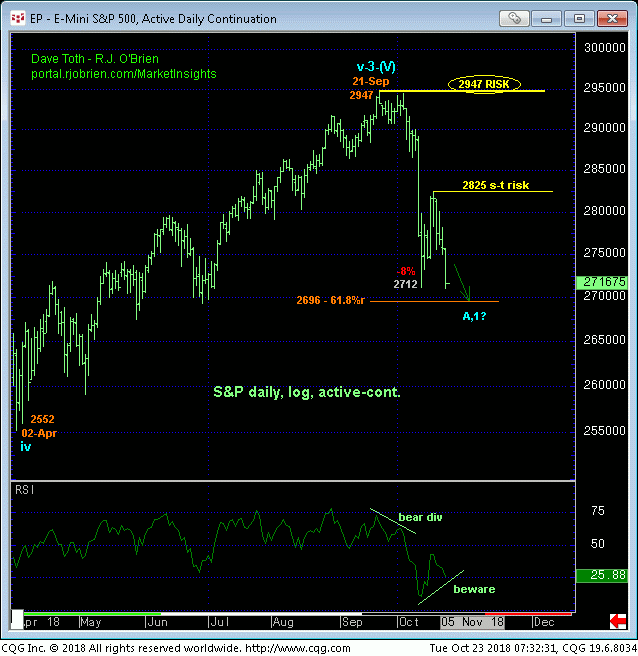
The daily log chart above shows the resumption of the past month’s reversal as well as the developing POTENTIAL for a bullish divergence in momentum. But this potential means nothing until and unless the market PROVES strength above 2825 and CONFIRMS the divergence to the point of non-bearish action like short-covers. In lieu of such proof, the market’s downside potential for what we believe is just the initial (A- or 1st-Wave) of a larger-degree correction lower is indeterminable and potentially steep. A similar 12% plunge to late-Jan/early-Feb’s would project to the 2590-area as a comparison, and herein lies the rationale for having even long-term players move to a neutral/sideline position following the failure below 2796; to circumvent the depths unknown of an initial counter-trend decline.
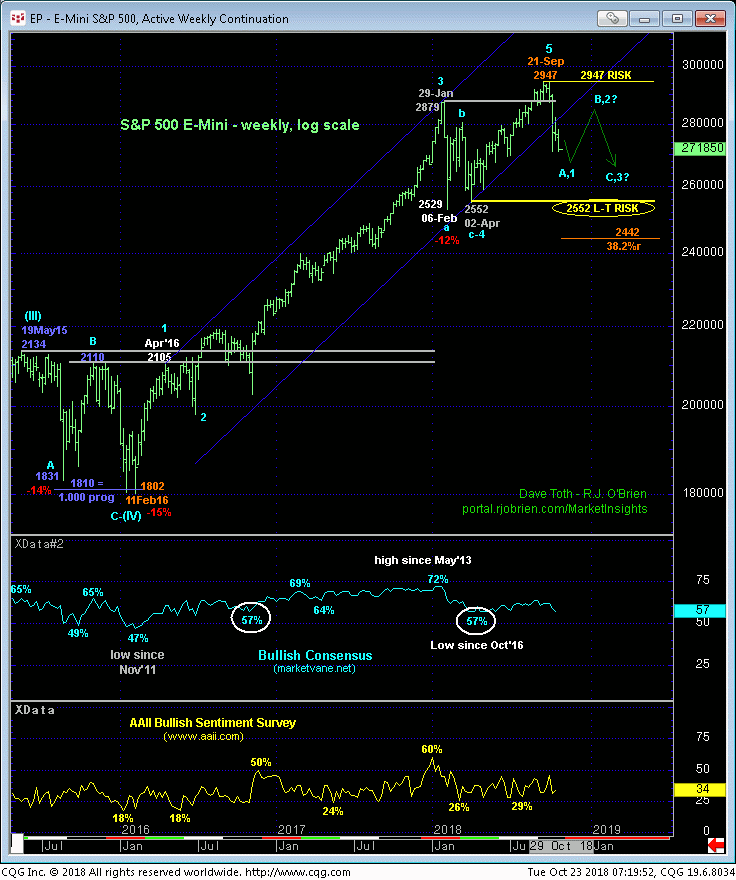
As also discussed however and similar to Feb-Mar’s steep (B-wave) corrective rebuttal, traders remain advised to be watchful for a countering bullish divergence in momentum needed to stem this relapse and expose what could be an extensive corrective rebuttal that 1) may offer a compelling risk/reward trade from the bull side first and 2) provide a preferred risk/reward environment for taking longer-term defensive measures from what could be levels above 2850.
These issues considered, a neutral-to-cautiously-bearish policy is advised with strength above 2782 required to threaten this cal and expose the (B- or 2nd-Wave) correction higher we believe is coming sooner or later. In lieu of such 2782+ strength, further and possibly accelerated, emotional losses should not surprise straight away. Former 2735-to-2750-area support would be expected to hold as new near-term resistance.


