Posted on Jun 07, 2023, 09:30 by Dave Toth
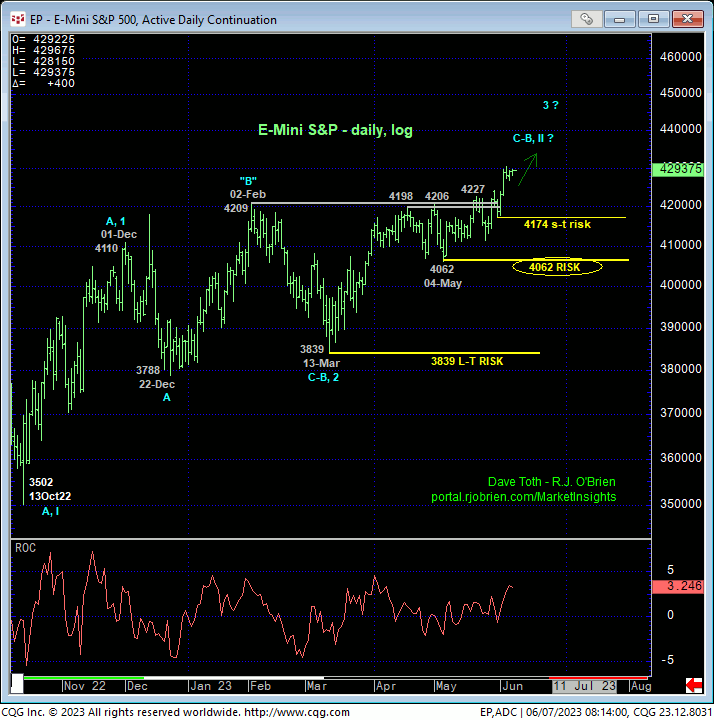
Fri and this week’s impulsive gains above mid-to-late-May’s 4228-to-4243-area resistance clearly reaffirms the broader recovery from last Oct’s 3502 low and leaves 31-May’s 4174 low in its wake as the latest smaller-degree corrective low this market is now minimally required to fail below to even defer, let alone threaten this 8-month uptrend. Per such, we advise shorter-term traders with tighter risk profiles to trail their short-term risk parameter from 24-may’s 4114 low discussed in 31-May’s Technical Blog to 4174.
Former 4243-to-4228-area resistance, since broken, is considered new near-term support ahead of further and possibly accelerated gains.


Stepping back to a daily log scale basis above, this chart shows the market clearly above the past FOUR MONTHS’ resistance ranging from 4227-to-2409. If this market has broader bullish aspirations and potential, it should not only easily be able to sustain gains above the lower-4200-handle-area, it should also BEHAVE LIKE A BULL by sustaining trendy, impulsive, increasingly obvious price action higher. And it should do so straight away.
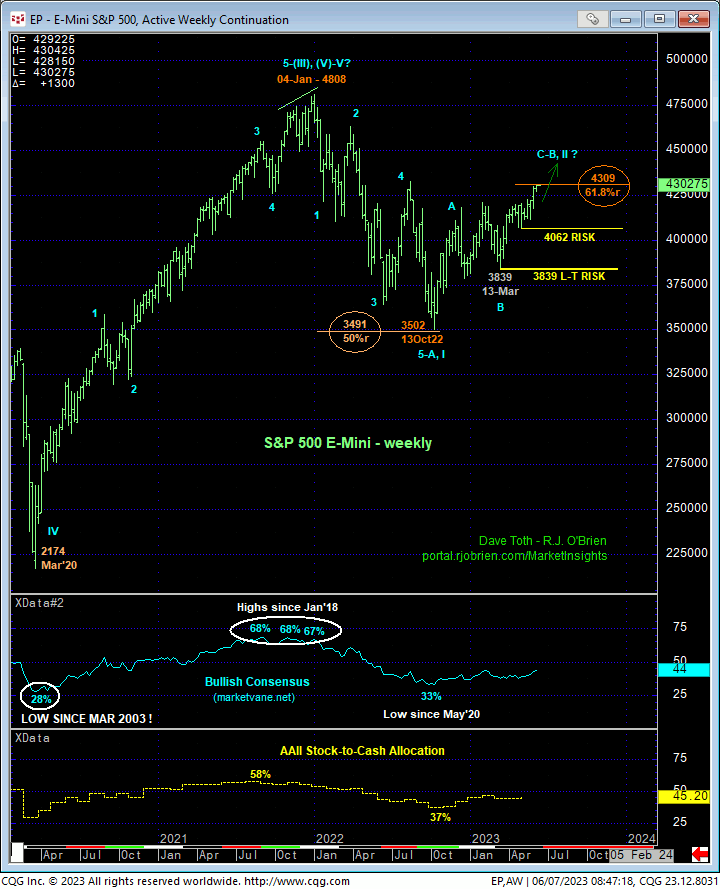
Against this bullish backdrop, a failure below 31-May’s 4174 smaller-degree corrective low and short-term risk parameter will be of an INsufficient scale to conclude a top. But such sub-4174 weakness would be hard to ignore as a warning of subsequent weakness below 04-May’s 4062 larger-degree corrective low and key bull risk parameter this market MUST stay above to maintain the uptrend from 13-Mar’s 3839 major corrective low. These levels- 4174, 4062 and 3839- define THE specific risk parameters on which a still-bullish policy and exposure can be objectively based and managed. And these risk parameters may come handy as the market engages the (4309) 61.8% retrace of 2022’s 4808 – 3502 decline shown in the weekly chart below.

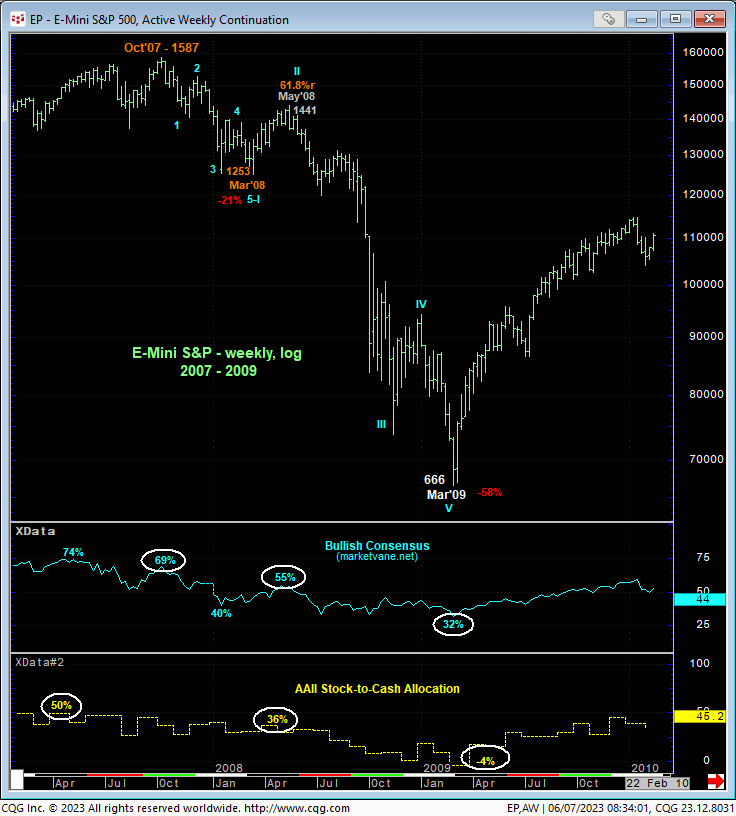
Longer-term traders and investors are reminded of how 2007 – 2008’s major peak/reversal process unfolded in the weekly log chart below. After Oct’07 – Mar’08’s 21% decline from 1587 to 1253, the market recovered within 9-pts of the (1450) 61.8% retrace of the prior decline before the (3rd-Wave) brunt of that major bear market took hold. Pertinent in the chart below is Jan-May’08’s price action that recovered “enough” for the Bullish Consensus (marketvane.net) measure of market sentiment to recover to a 55% level before the bottom fell out. This contrary opinion measure showed the masses acquiescing to the bull, ultimately leaving them vulnerable to the resumed bear.
In 2008 few were calling for a major bear market and recession, unlike today, where you can’t watch a financial news show or read a financial publication that doesn’t comment on the coming recession. As a result, and especially given the past few days’ continuation of an 8-month uptrend, traders should beware further and possibly accelerated gains needed to seduce the masses to acquiesce to the broader bull. But even then, and as happened in Jun’08, a CONFIRMED bearish divergence in momentum is required to arrest the clear and present uptrend and resurrect a broader peak/reversal count. Herein lies the absolutely crucial importance of the corrective lows and risk parameters identified above at 4174, 4062 and 3839.
Major bear markets rarely sneak up on anyone. Indeed, they start with smaller-degree momentum failures pertinent to shorter-term traders that morph into larger-degree momentum failures pertinent to institutional players and investors. IF there’s a 2008 – 2009-type repeat to last year’s 4808 – 3502 downtrend, we will navigate the prospects of such precisely around/below levels like 4174, 4062 and especially 3839. Until and unless such weakness is proven, the trend is up on all practical scales and should not surprise by its continuance, warranting a continued bullish policy and exposure.


