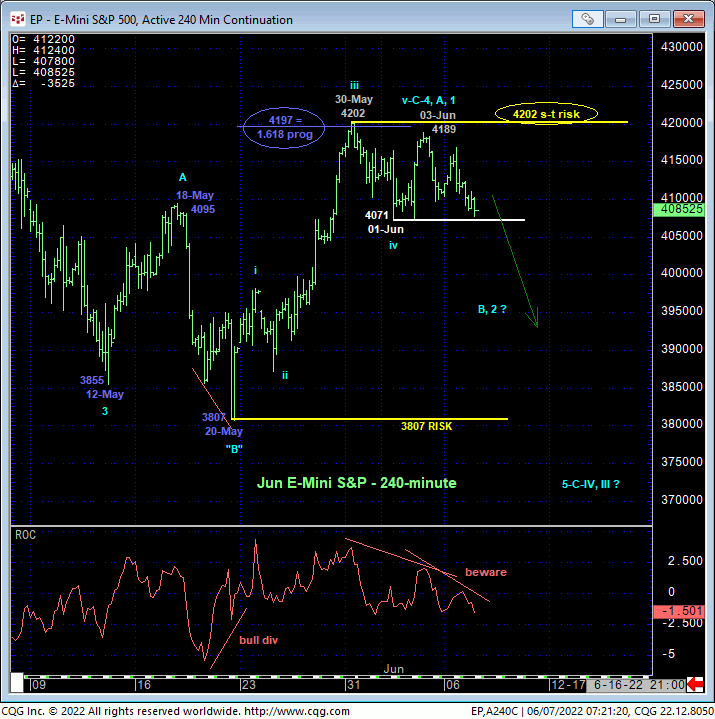
Looking at the 240-min chart below, upside momentum has clearly been waning for the past week. A break below 01-Jun’s 4071 corrective low will CONFIRM the divergence, break the uptrend from 20-May’s 3807 low and expose at least a (B- or 2nd-Wave) correction of late-May’s rally. At most, such a sub-4071 failure will re-expose the secular bear market to new and perhaps significant new lows below 3807.
A failure below 4071 will expose a wave count that, we believe, would define last Fri’s 4189 high as the orthodox end to a broader bear market correction that actually started with 12-May’s 3855 low. This count argues that 20-May’s 3807 low is a B-Wave “irregular” (i.e. actually breaking to a new low below the end of the 3rd-Wave) within the entire corrective recovery. The high point for this correction would be 30-May’s 4202 high. But since the underlying S&P 500 cash index posted a new high on Thurs on an hourly close-only basis, completing a textbook 5-wave (c-wave) up from the 20-May low, we believe that Fri’s 4189 high in the contract completed the correction. Per such, we’re identifying 4202 as our new short-term risk parameter from which traders can objectively rebase and manage the risk of a resumed bearish policy and exposure.
The Fibonacci fact that the suspected completing C-Wave of this proposed count from 20-May’s 3807 low spanned a length within a five points of the (4197) 1.618 progression of mid-May’s 3855 – 4095 prospective A-Wave would seem to reinforce this count. If correct, a trendy, impulsive resumption of the secular bear market to new lows below 3807 would be forthcoming.
Given the 5-wave impulsiveness of the late-May/early-Jun rally however, we cannot ignore an alternate bullish count that would contend this rally is the A- or 1st-Wave of a broader BASE/correction/recovery count. Reinforcing evidence of such a bullish count would have to come in the form of a relapse-stemming bullish divergence in short-term momentum from a level north of 20-May’s obviously pivotal 3807 low and proof of 3-wave corrective behavior on this relapse attempt. A subsequent recovery above 30-May’s 4202 high would confirm such a bullish count and expose potentially sharp gains thereafter.


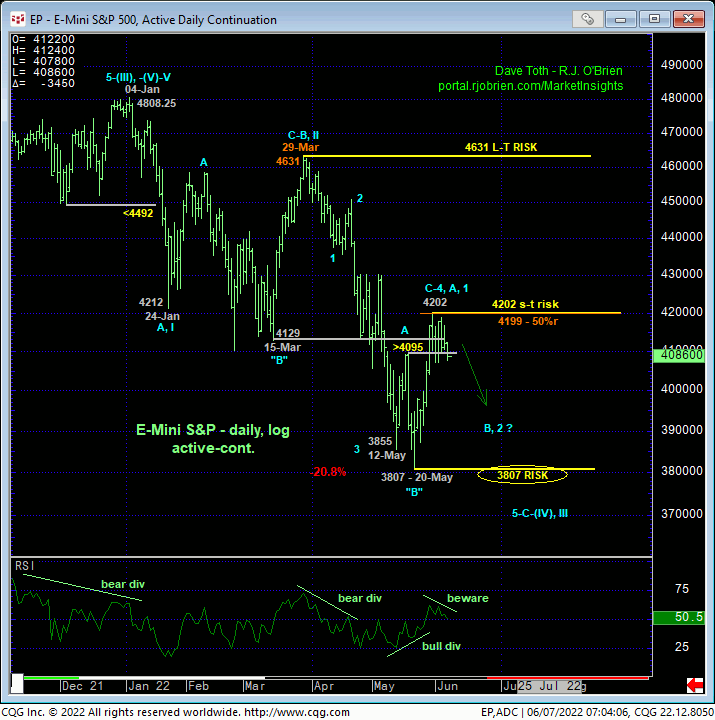
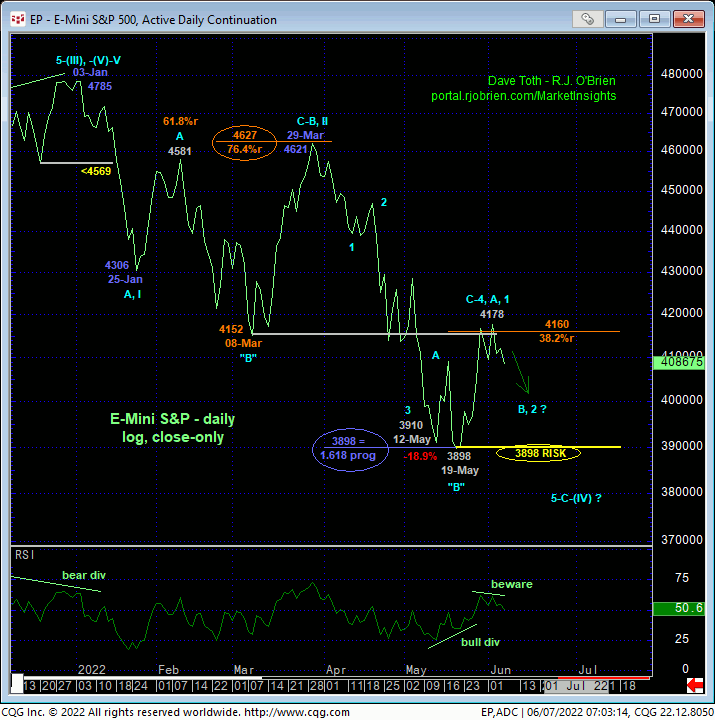
ON a broader scale, the daily log scale high-low chart above and close-only chart below show the developing potential for bearish divergences in momentum from the immediate area around the 50% retraces of Mar-May’s declines. The mid-4150-area was also key support in early-Mar that, since broken, is considered a key new resistance area per any broader bearish count. It’s not hard at all to envision the recent recovery attempt as another mere correction within the major bear trend and where a short-term momentum failure below 4071 may re-expose that bear.
The key takeaway here is the developing importance of recent highs in the 4178-to-4202-area. IF the recent recovery is just the initial (A- or 1st-Wave) start to a more significant correction or reversal HIGHER, then it is imperative for this market to now survive 3-wave corrective relapse attempts and then recoup these recent highs and resistance. Until and unless this specific behavior and requirements are satisfied, traders and investors should not be surprised by a dramatic resumption of the secular bear trend to new lows below 20-May’s 3807 low. And once below 3807, there are NO pertinent technical levels of any merit to potentially hold the market up.

Finally and on an even broader weekly log scale below, the very long-term technical elements for a major peak/reversal we’ve discussed since 20-Jan’s bearish divergence in WEEKLY momentum arguably maintain a major bearish count. TO THIS POINT, the 20% decline from 04-Jan’s 4808 all-time high is only a 3-wave affair. Left unaltered by resumed weakness below 20-May’s 3807 low and longer-term bull risk parameter, this 3-wave decline cannot be ignored as a major correction within the secular bull market that may be trying to resume. But to CONFIRM such a bullish count, the market needs to recoup 29-Mar’s 4631 high. If one wants to bet on such a bullish count, this is fine; the risk is clear at 3807. A break below 3807 negates any bullish count and reaffirms a major bearish one to indeterminately lower levels. Intermediate-term strength above 4202 will reinforce such a bullish prospect. Until such 4202+ strength is proven, at least a deeper correction of the recent 3807 – 4202 recovery is anticipated, if not a resumption of the secular bear trend to new lows below 3807.
These issues considered, traders are advised to return to a bearish policy on the immediate failure below 4071 with a subsequent recovery above 4202 required to negate this call and warrant its cover. In lieu of such 4202+ strength, further and possibly protracted losses are anticipated.


