Posted on Mar 10, 2023, 10:16 by Dave Toth

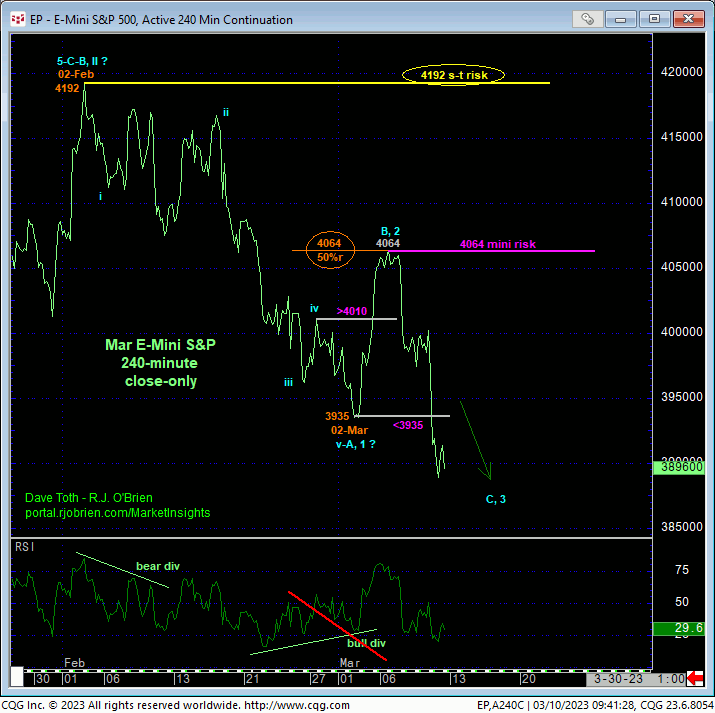
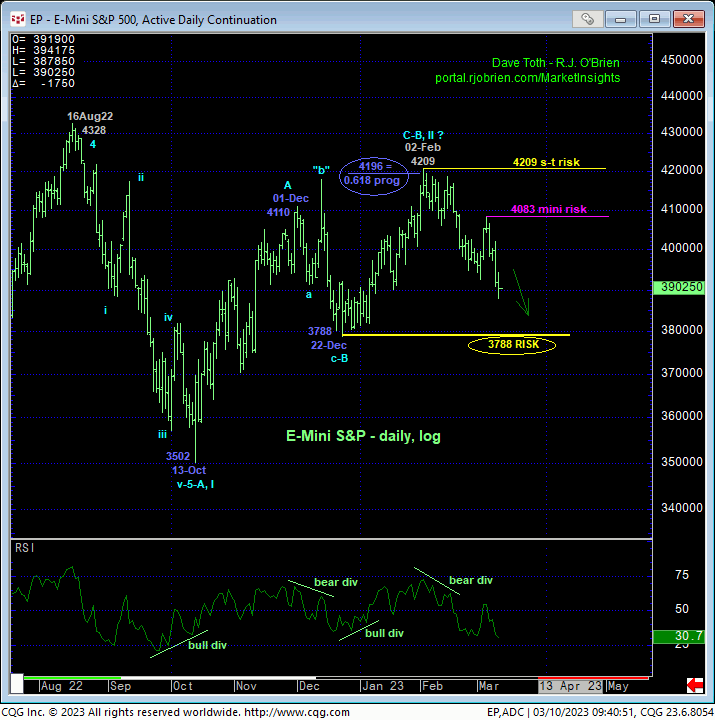
In 03-Mar’s Technical Blog following that day’s bullish divergence in short-term momentum, we warned traders to approach that recovery attempt cautiously and suspiciously as it was indeterminable whether Feb’s preceding decline was a 3- or 5-wave affair. By virtue of yesterday and today’s impulsive relapse below 02-Mar’s resulting 3925 low and mini bull risk parameter, the market has nullified that bullish divergence in short-term mo, chalked up the early-Mar recovery attempt as a correction and reinstated AT LEAST the intermediate-term downtrend. The resulting by-products of this resumed decline are the markets definition of Mon’s 4083 high as the latest smaller-degree corrective high and reaffirmation of 02-Feb’s 4209 high as the prospective END to a 3-wave and thus corrective recovery attempt from last Oct’s 302 low. Per such, these levels serve as our new mini and continued short-term risk parameter from which non-bullish decisions like long-covers and bearish punts can be objectively based and managed.
Reinforcing Mon’s 4083 intra-day high as a new bear risk parameter is the Fibonacci fact that that day’s 4064 high was the exact 50% retrace of Feb-Mar’s 4192 – 3935 decline on a 240-min close-only basis below.


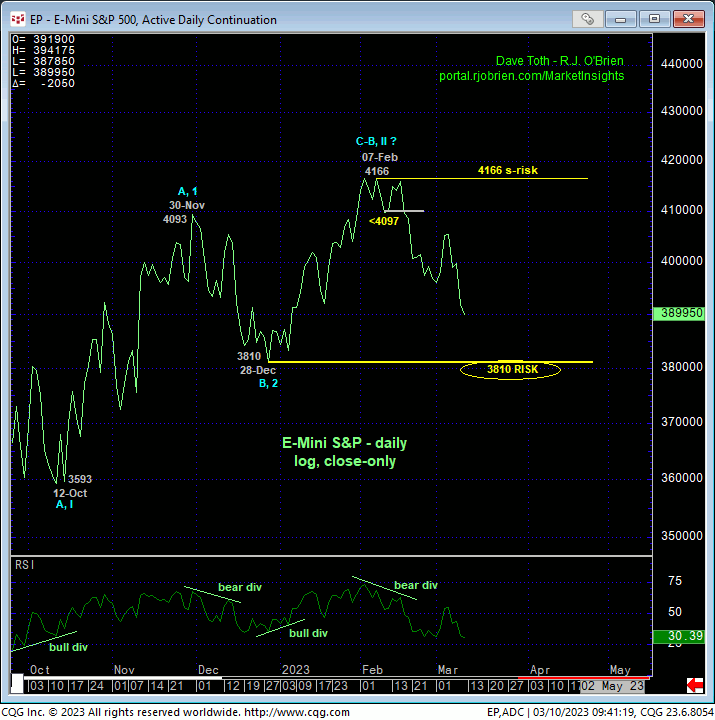
While AT LEAST the intermediate-term downtrend has been reaffirmed, the market remains ABOVE 22-Dec’s 3788 intra-day low and 28-Dec’s 3810 low close that we maintain as our long-term BULL risk parameters. These are the levels this market still needs to break to render Oct-Feb’s entire recovery attempt a 3-wave and thus corrective structure that would re-expose 2022’s major downtrend that preceded it. And even then, the market would remain a goodly distance away from last Oct’s obviously key 3502 low it needs to break to reinstate the secular bear market. This said, major reversal processes always begin with smaller-degree reversals like we’ve seen since 17-Feb’s bearish divergence in momentum discussed in 21-Feb’s Technical Blog.

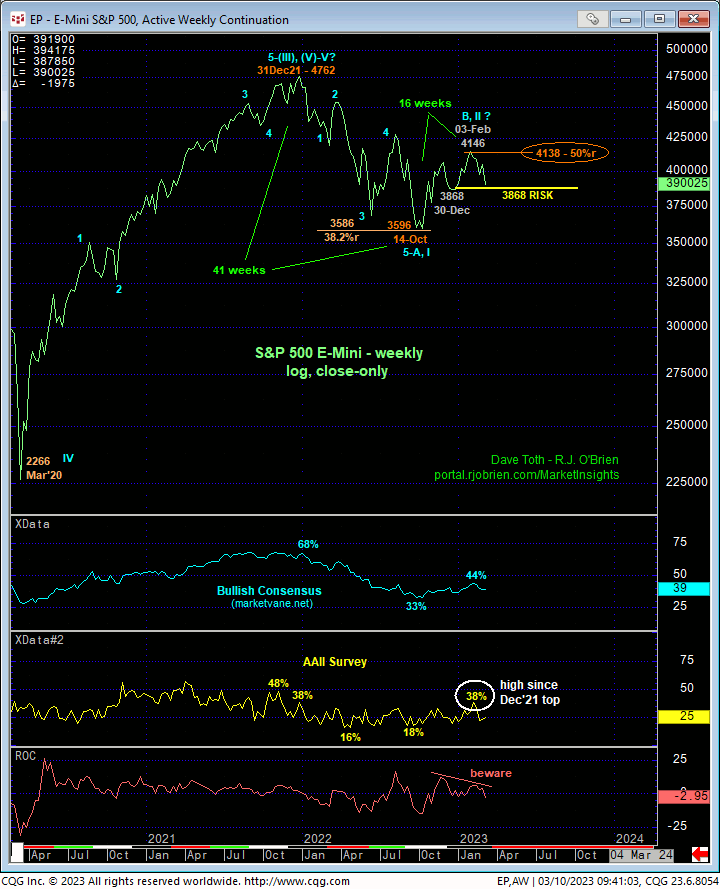
On an even broader weekly log close-only basis, the chart below shows the nicely developing POTENTIAL for a bearish divergence in momentum. This indicator will be considered confirmed on a weekly close below 30-Dec’s 3868 corrective low close and/or an intra-day break below 22-Dec’s 3788 larger-degree corrective low and key bull risk parameter discussed above. Below these late-Dec thresholds, the extent of the market’s weakness and vulnerability thereafter should not be underestimated, including a resumption of last year’s major bear market.
Trying to find flies in the bearish ointment, this weekly chart below also shows the market’s position pretty much smack in the middle of a lateral range that has constrained it since MAY of last year. The reason we point this fact out is that the middle-halves of ranges are notorious for exactly the type of aimless whipsaw risk that has described this market’s behavior for many months now. Under such lateral, choppy conditions, the risk/reward metrics of directional exposure are abhorrent, warranting a more conservative approach to directional risk assumption. And herein lies the vital importance of identifying specific risk parameters like 4083 and 4209 on the bear side and 3788 on the bull side.
IF IF IF 02-Feb’s 4209 high COMPLETED a major 3-wave correction from last Oct’s 3502 low, then we should expect the resumed major bear to BEHAVE LIKE ONE below 3788 by sustaining trendy, impulsive, increasingly obvious behavior to the downside. Countering bullish divergences in momentum, especially above a levels like 4083 and 4209 and newly defined corrective highs as the market continues lower would NOT be expected per such a bearish count. Conversely and on the heels of the past couple days’ resumption of the past month’s downtrend, a confirmed bullish divergence in momentum is absolutely required SOON to diffuse this resumed bearish threat.
These issues considered, shorter-term traders are advised to continue or resume a bearish policy and exposure with a recovery above at least 4083 required to threaten this call and warrant its cover. Longer-term institutional players and investors are urged to pare bullish exposure to more conservative levels and jettison ALL remaining exposure on a failure below 3788 that could re-expose last year’s major bear market to new lows below 3502.


