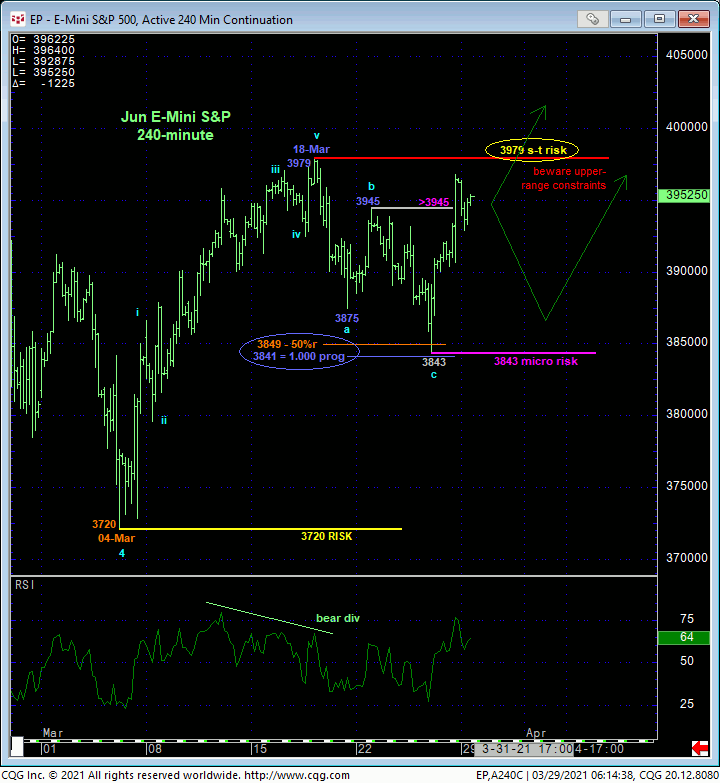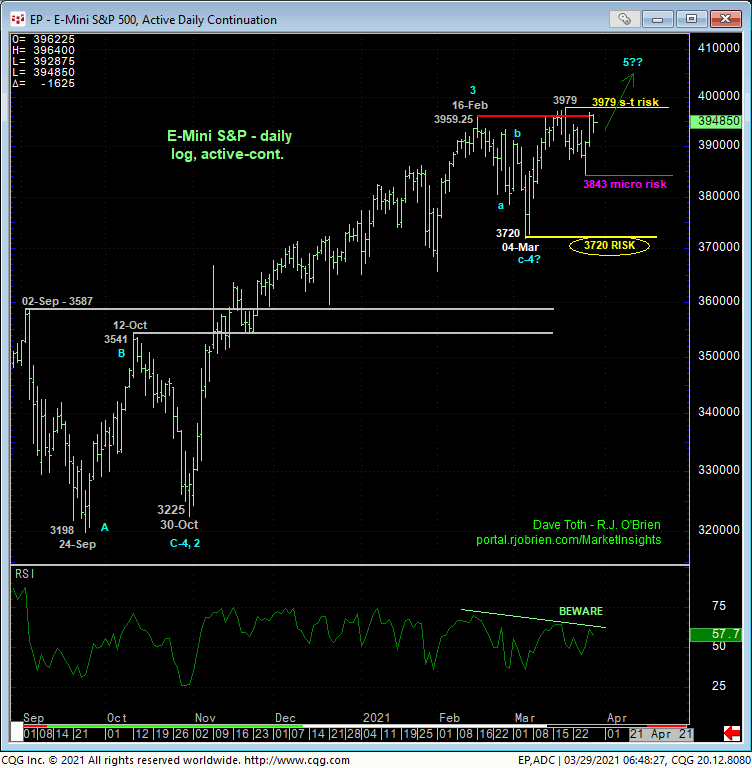
The market’s recovery Fri afternoon above 22-Mar’s 3945 high and micro risk parameter we discussed in Wed’s Technical Blog renders the sell-off attempt from 18-Mar’s 3979 high to Thur’s 3843 low a 3-wave affair as labeled in the 240-min chart below. Left unaltered by a relapse below 3843, this 3-wave decline is considered a corrective/consolidative event consistent with a broader bullish count. Per such, this 3843 low may be used as a another smaller-degree but objective risk parameter from which shorter-term traders with tighter risk profiles- whipsawed out of bullish exposure following 19-Mar’s momentum failure- can objectively rebase and manage the risk of non-bearish decisions like short-covers and cautious bullish punts.
Because 18-Mar’s 3979 high remains intact as a resistant hurdle following that 19-Mar mo failure however, it is indeterminable at this juncture whether Thur’s 3843 low COMPLETED the correction ahead of a more immediate resumption of the secular bull OR if further lateral consolidation between these two key flexion points at 3979 and 3843 lies ahead, in which a relapse to this range’s lower recesses might precede the longer-term bull’s resumption.
Such consolidative chop and allowance/awareness of such is common in all markets and on all scales, occurring roughly 2/3rds of the time, a departure from the easier, trending environments where the odds of making money are higher. The important takeaway here however is that the market has identified a relatively short-term low and support at 3843 from which shorter-term traders with tighter risk profiles can objectively rebase and manage the risk of a resumed bullish policy and exposure. A failure below 3843 will resurrect downside risk we feared last Wed, exposing a field devoid of any technical levels of merit shy of 04-Mar’s 3720 next larger-degree corrective low and key long-term bull risk parameter.


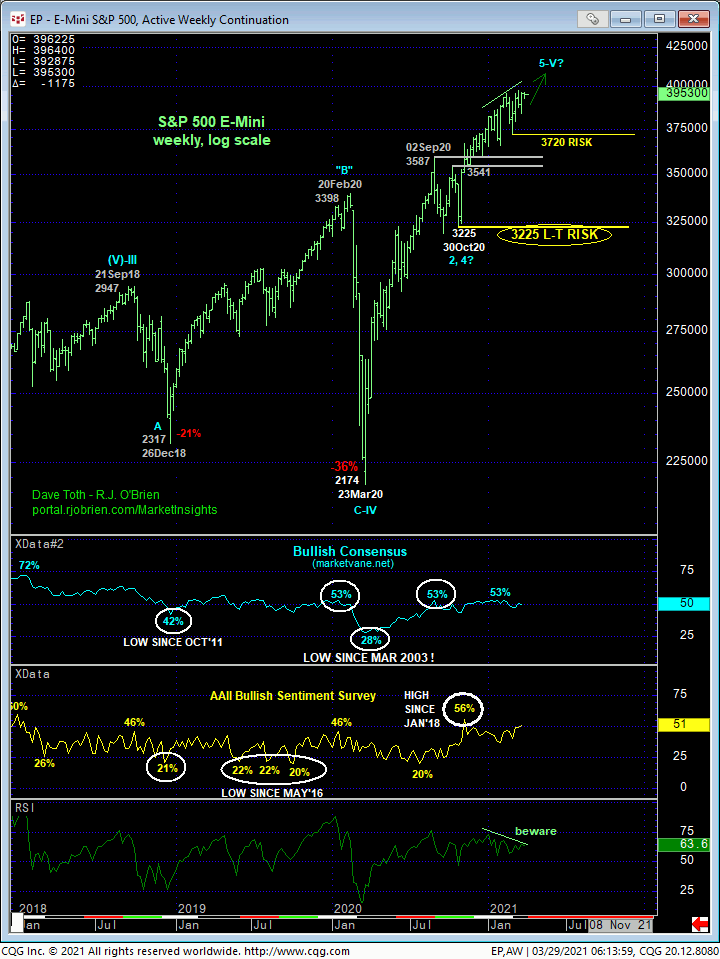
Traders of all scales and risk profiles MUST keep these corrective lows and bull risk parameters in mind when managing the risk of a bullish portfolio or position. For while only a glance at the weekly log scale chart below is needed to see that the major uptrend remains as the dominant technical element, it’s also easy to see threats to the bull in the forms of upside momentum that’s arguably been waning for months and sentiment/contrary opinion levels that are at or near those that have warned of and accompanied this market’s major corrections and reversals. In order to maintain the risk/reward merits of a bullish policy, it is absolutely imperative that this bull continues to BEHAVE LIKE ONE by, quite simply, sustaining trendy, impulsive price action above these recent corrective lows and risk parameters.
Indeed, given the magnitude of this secular bull market, there could be tons of accelerated upside ahead. Tons. Everyone is quite aware of the sharply rising interest rates and commodity prices globally that will eventually impact equity prices negatively and potentially drastically. But we believe the odds of such a hit to stocks will increase when two things happen: 1) indexes like the S&P start failing below larger-degree corrective lows like 3720 and 2) when gold gets bid once again. (While the Aug’20 – Mar’21 sell-off in gold remains well within the bounds of a mere but major correction, it must arrest this 7-month slide with a recovery above at least 1815.2 to resurrect the secular bull and perhaps indicate an inflation flight).
These issues considered, a bullish policy and exposure remain advised for long-term players and investors with a failure below 3720 still required to take defensive measures. Shorter-term traders whipsawed out of bullish exposure on 19-Mar’s short-term momentum failure are advised to return to a bullish policy, but the current upper recesses of the past couple weeks’ 3979 – 3842-range presents a poor risk/reward condition from which to do so. Rather, we advise waiting for either a 3979+ breakout to resume a bullish position or following a return to this range’s lower-quarter around 3877 OB, with a failure below 3843 negating this call and warranting its cover. Needless to say, a breakout above 18-Mar’s 3979 high reinstates the secular bull trend and exposes further, indeterminable and potentially major gains thereafter.


