Posted on Nov 23, 2022, 09:08 by Dave Toth
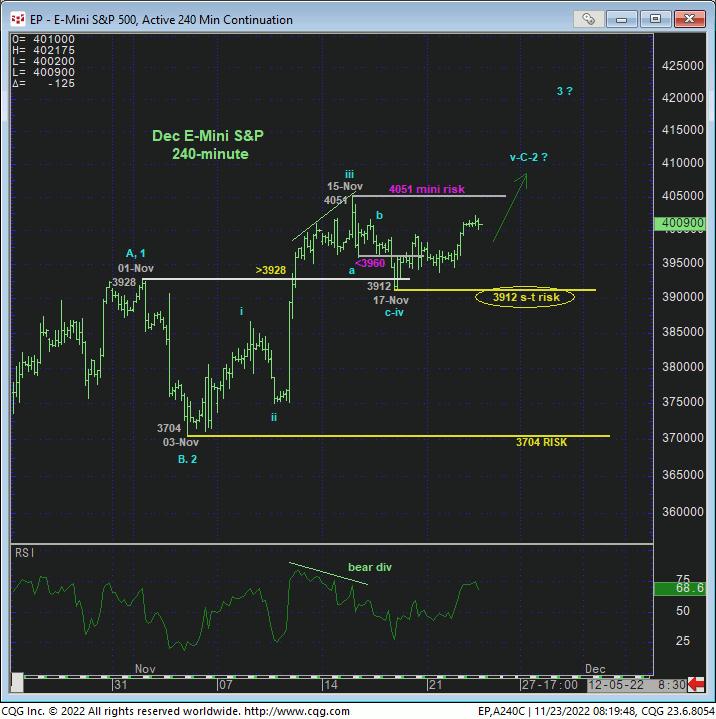
While the market has yet to take out last week’s 4051 high left in the wake of 17-Nov’s bearish divergence in very short-term momentum, yesterday’s recovery was enough to render last week’s setback to Thur’s 3912 low a 3-wave affair as labeled in the 240-min chart below. Left unaltered by a relapse below 3912, this 3-wave setback is considered a (suspected minor 4th-Wave) corrective/consolidative event that warns of a (minor 5th-Wave) resumption of early-Nov’s uptrend that preceded it to at least one more round of new highs above 4051. Per such, we’re defining 3912 as our new short-term risk parameter from which shorter-term traders with tighter risk profiles can objectively rebase and manage the risk of a continued bullish policy and exposure.
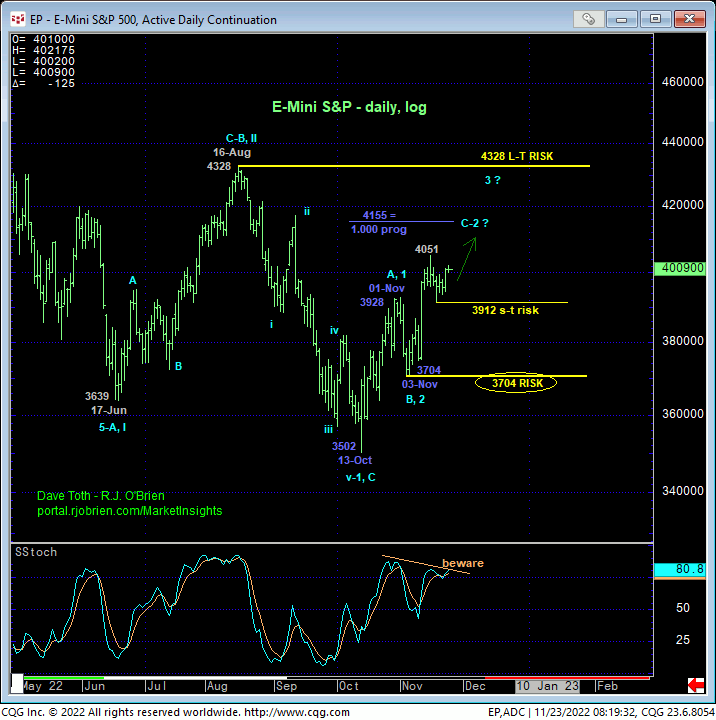
From an intermediate-term perspective shown in the daily log chart above, the trend remains clearly up with the rally from 03-Nov’s 3704 low one of only two things: the completing C-wave to a broader bear market correction or the dramatic 3rd-Wave of an eventual 5-wave sequence to levels above 16-Aug’s pivotal 4328 high and our key long-term bear risk parameter. A failure below our short-term risk parameter at 3912 will provide an early indication of further pending weakness, but a commensurately larger-degree failure below 3704 is now required to render the recovery from 13-Oct’s 3502 low a 3-wave and thus corrective structure that would then re0-expose this year’s secular bear market. Per such, this 3704 level serves as our new long-term bull risk parameter pertinent to longer-term institutional traders and investors.
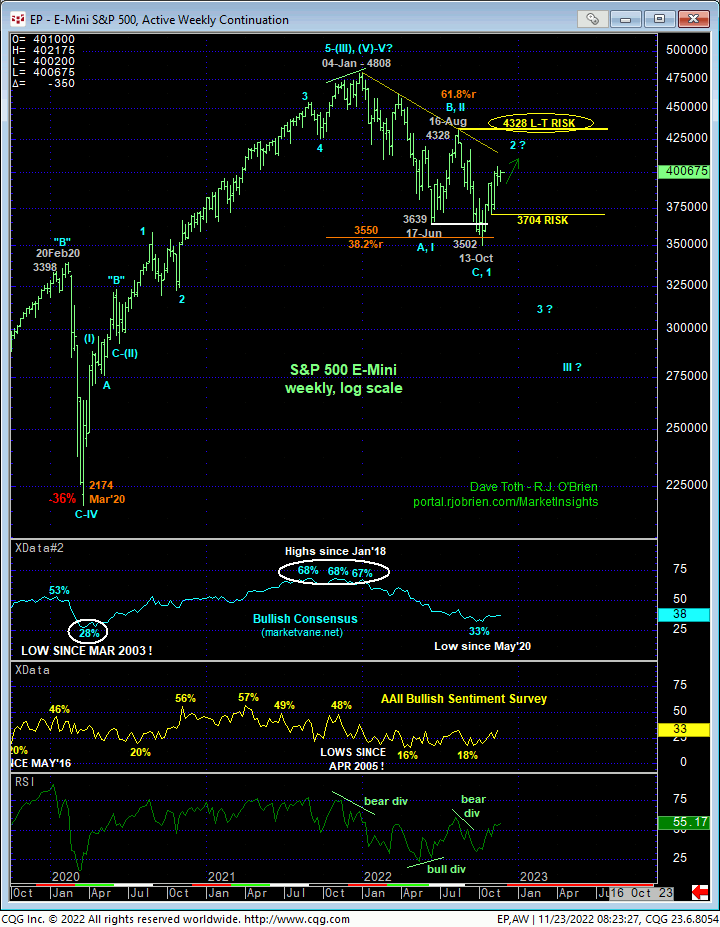
Longer-term players remain advised to recognize the past couple months’ not unimpressive recovery as a subset of this year’s major downtrend on a weekly log scale basis below. Against this broader bearish backdrop, commensurately larger-degree strength above 16-Aug’s 4328 larger-degree corrective high remains required to, in fact, break this year’s downtrend needed to defer or threaten our long-term bearish count. IF this long-term bearish count is still intact, we would expect the market to arrest this current, clear and present recovering uptrend with a bearish divergence in momentum somewhere between spot and 4328. And herein lies the importance of recent corrective lows and risk parameters specified at 3912 and especially 3704.
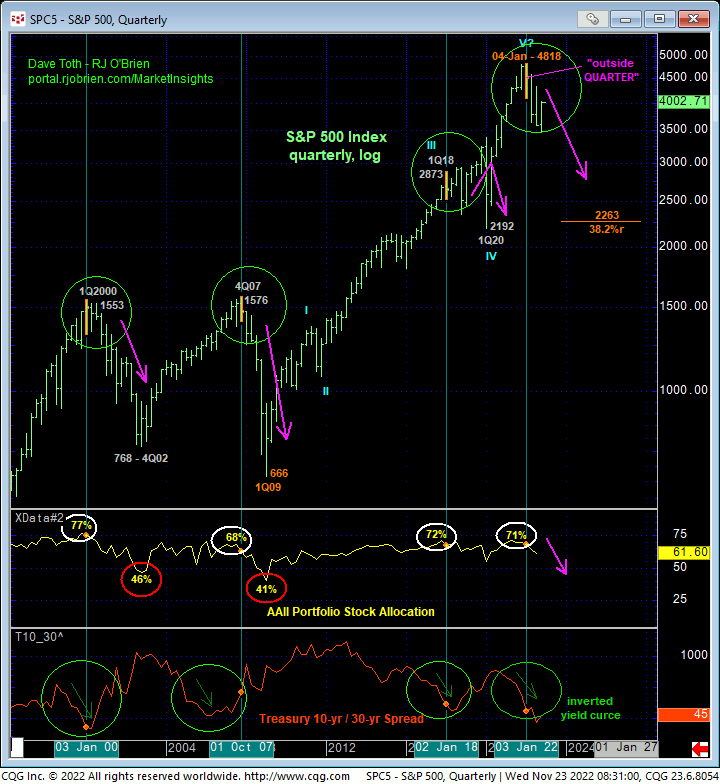
On an even longer-term basis, the quarterly log scale chart above shows the key elements on which our major peak/reversal count is predicated:
- confirmed bearish divergences in daily, weekly and monthly momentum back in Jan-Feb amidst
- historically
extreme bullish sentiment/contrary opinion in:
- the Bullish Consensus (marketvane.net)
- the American Association of Individual Investors (AAII) Sentiment Survey
- AAII portfolio equity allocations
- AAII equity-to-cash ratio
- an arguably complete and massive 5-wave Elliott sequence from Mar’20’s 2174 low
- an arguably and even more massive 5-wave Elliott sequence from 2009’s 666 low, and, perhaps most importantly,
- an inverted Treasury yield curve.
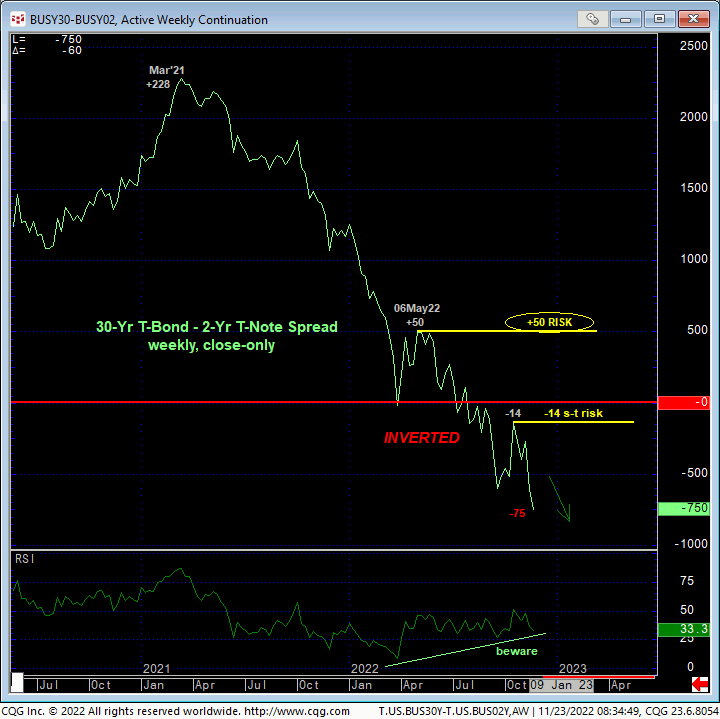
These same elements warned of an accompanied the 2018 – 2020 major and volatile lateral correction and the 2007 – 2009 and 2000 – 2002 major bear markets. And while the historic 26-MONTH rise in rates has stalled over the past month, the weekly close-only chart of the 2-Yr – 30-Yr Treasury yield spread below shows that its complete collapse and inversion continues to this day. We can all speculate on what the Treasury market is foretelling by this historical inversion in the yield curve, but past occurrences have preceded major stock market declines. Per such and until or unless this S&P contract recoups Aug’s 4328 high, traders and investors remain urged to keep the key issue of technical and trading SCALE in mind when considering the absolutely key matter of RISK to directional exposure.
These issues considered, an interim bullish policy and exposure are advised with a failure below 3912 required for shorter-term traders to move to a neutral/sideline position and for longer-term players and investors to pare exposure to more conservative levels. Subsequent weakness below 3704 will negate any bullish count, resurrect a major bearish count and warrant moving to at least a neutral, if not bearish policy ahead of potentially protracted losses. Until the market fails below at least 3912, further gains are anticipated. We will, of course, keep a keen eye on MOMENTUM as this rally extends to the 4050-to-4200-range.
