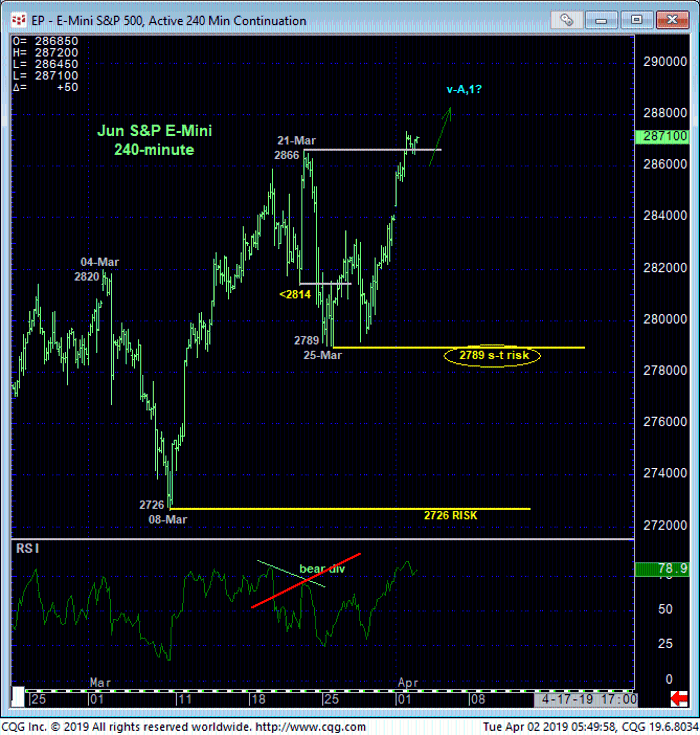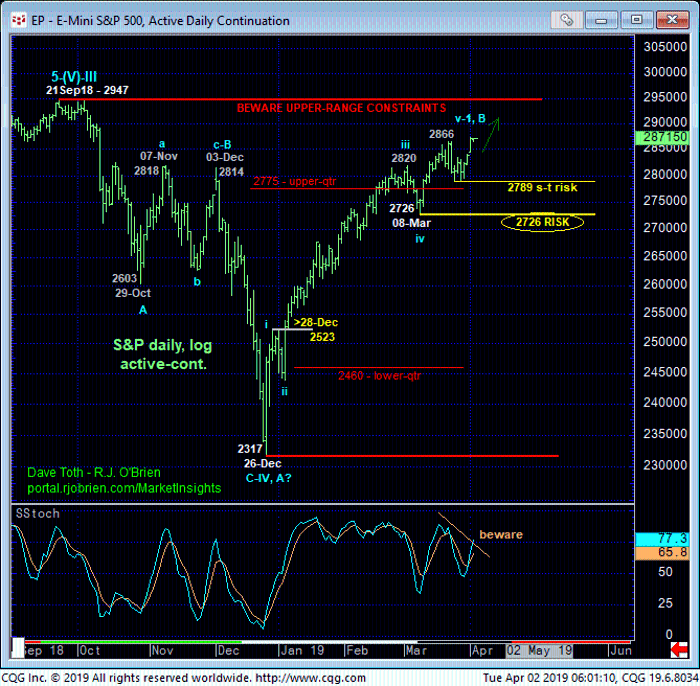
With yesterday’s recovery above 21-Mar’s 2866 high the market has negated 22-Mar’s bearish divergence in momentum and reaffirmed the uptrend from 26Dec18’s 2317 low. The important by-product of this resumed rally is the market’s definition of 25-Mar’s 2789 low as the latest smaller-degree corrective low the market now needs to sustain gains above t maintain a more immediate bullish count. Per such this 2789 level becomes our new short-term risk parameter from which a resumed bullish policy can be objectively rebased and managed by shorter-term traders whipsawed out of bullish exposure as a result of 22-Mar’s bearish divergence in mo.


This tight but objective risk parameter at 2789may come in handy given the market’s proximity to the extreme upper recesses of the range that has constrained prices since 21Sep18’s 2947 all-time high. Additionally, the daily log chart above also shows the developing POTENTIAL for a bearish divergence in momentum that adds to the slippery slope for bulls “up here”. Nonetheless, the trend is up and should not surprise by its continuance or acceleration until and unless the market weakens below at least last week’s 2789 corrective low.
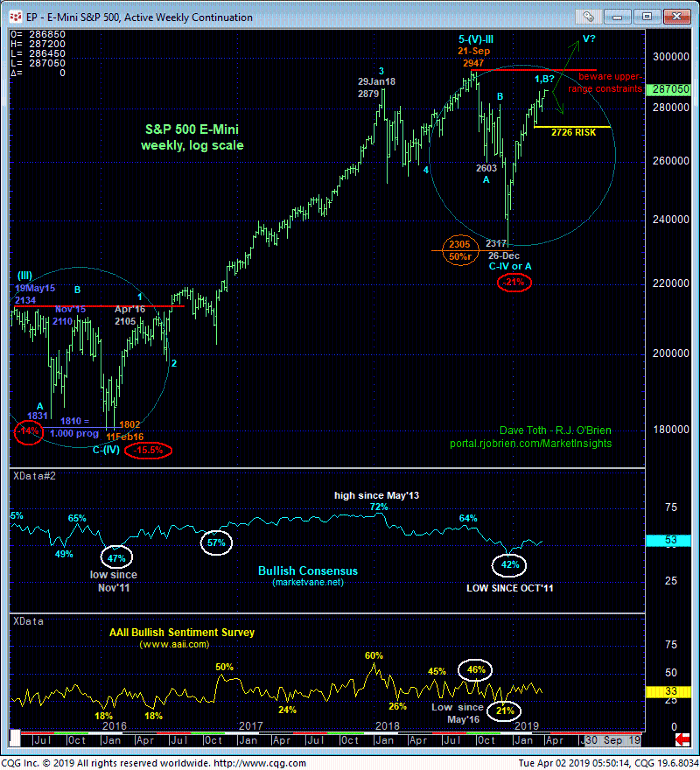
The weekly log chart below shows Aug-Nov’15’s severe retest of May’15’s 2134 high before the market resumed its correction that included another deep and emotional decline that produced the lowest, most bearish sentiment levels in four years. While last Sep’s 2947 high remains intact as a resistant cap and especially if the market fails below 08-Mar’s 2726 next larger-degree corrective low and key risk parameter, traders will have the opportunity to protect against what could be a dramatic return to the lower recesses of the 6-month range. While the market sustains levels above at least 2789 however, there’s no way to know the secular bull trend to new all-times highs is resuming straight away.
These issues considered, a bullish policy and exposure remain advised for long-term players with a failure below 2726 required to threaten this view enough to warrant its cover. Shorter-term traders wit tighter risk profiles whipsawed out of bullish exposure with 22-Mar’s bearish divergence in momentum are advised to return to wait for a smaller-degree corrective setback attempt and rejected/defined low via a confirm bullish divergence in short-term mo for a more favorable risk/reward buying opportunity.


