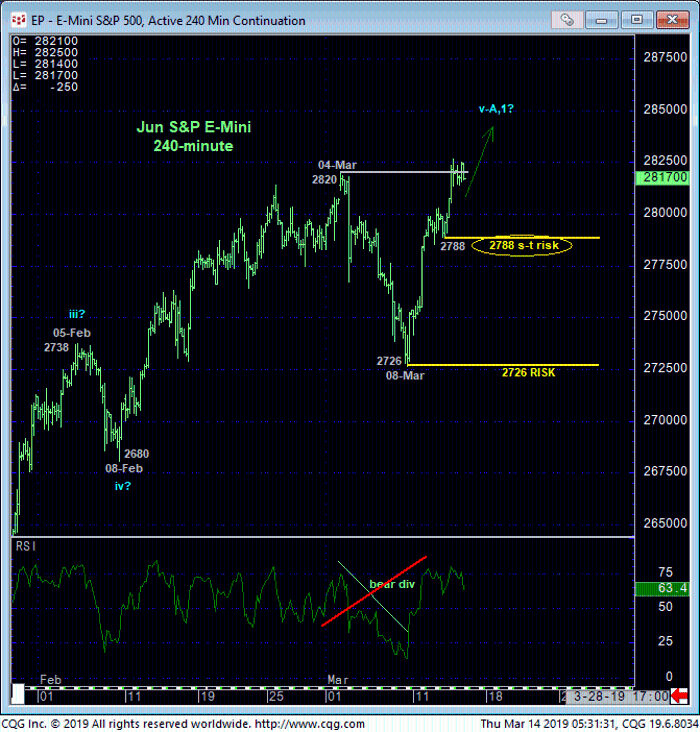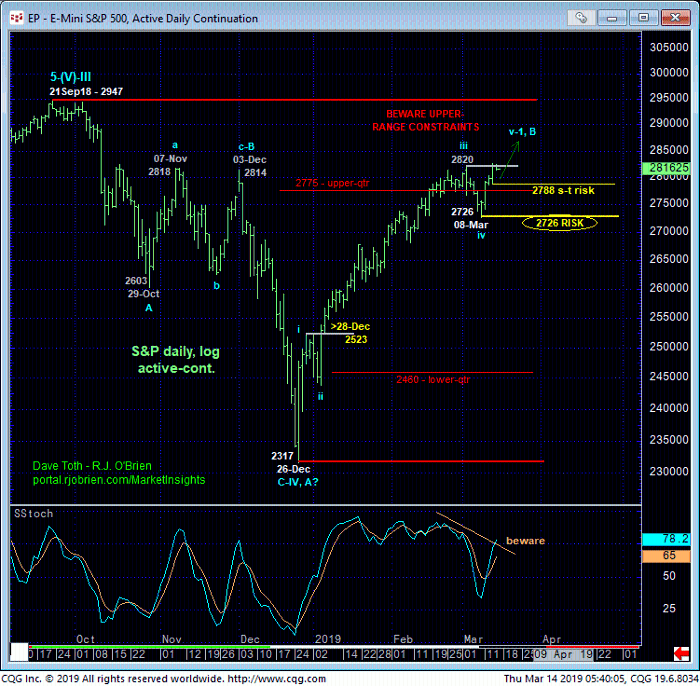
The market’s recovery yesterday above our short-term risk parameter defined by 04-Mar’s 2820 high nullifies 04-Mar’s bearish divergence in short-term momentum and chalks up that resulting selloff attempt as a mere correction within the past 2-1/2-months’ recovery from 26Dec18’s 2317 low. This resumed strength leaves smaller- and larger-degree corrective lows in its wake at 2788 and 2726, respectively, that the market is now obligated to sustain gains above to maintain a more immediate bullish count. Its failure to do so will threaten and then confirm another bearish divergence in momentum that, from the upper-quarter of the 6-month range, could leave the market prone to a correction of indeterminable and potentially protracted scope. Per such these 2788 and 2726 levels become our new short- and longer-term risk parameters from which a bullish policy and exposure can be objectively rebased and managed.


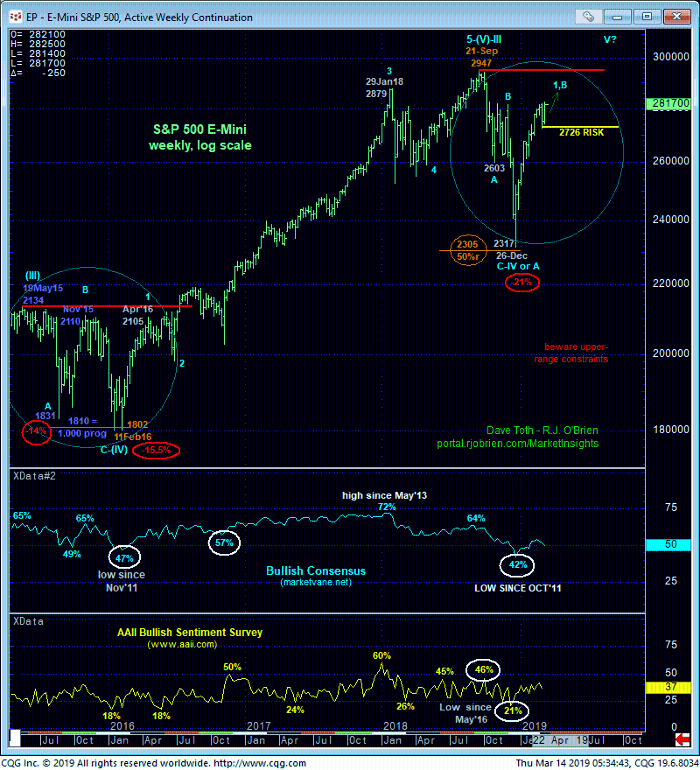
While the 2-1/2-month uptrend has resumed and could now accelerate higher, even to new all-time highs above 21Sep18’s 2947 high, the daily (above) and weekly (below) log scale charts show the market’s precarious position at the upper-quarter of the past six months’ range. If there’s a time and place to be leery of the market rolling over, it is here and now. And we will gauge such a roll-over with the market’s failure to sustain recent gains, first above 2788 and then certainly above 2726.
Indeed, one need only look at the Oct-Nov’15’s severe retest of May’15’s 2134 then-all-time high before what became a very emotional and headline rout to complete the entire 9-month, 15.5% correction. If the market failed below 08-Mar’s key 2726 corrective low and broke the impressive and impulsive uptrend, there’s no guaranty that the market would tank towards Dec’s 2317 low. But if longs aren’t protected/covered on the immediate failure below 2726, there is no other level below that flexion point to do so objectively shy of 26-Dec’s 2317 low. The only “technical levels” that exist below this market-defined low at 2726 are “derived” levels like Bollinger Bands, imokus, Fib relationships and the ever-useless moving averages that have NEVER proven to be reliable reasons to bet on support for the falling knife without an accompanying bullish (in this case) divergence in momentum.
Until and unless the market fails below 2726 however, the trend is up on all practical scales and should not surprise by its continuance or acceleration, including a run to new all-time highs above 2947. These issues considered, a bullish policy and exposure remain advised for long-term players and investors with a failure below 2726 required to threaten this call enough to warrant moving to a neutral/sideline position in order to circumvent the depths unknown of a larger-degree correction of Dec-Mar’s rally OR a resumption of the much broader correction down from Sep’18’s 2947 high. Shorter-term traders with tighter risk profiles whipsawed out f bullish exposure following 04-Mar’s bearish divergence in short-term mo are advised to reinstate a cautious bullish policy and first approach setback attempts to the 2810-to-2800-range as corrective buying opportunities with a failure below 2788 negating this count and warranting its cover. In lieu of weakness below at least 2788 and preferably 2726, further and possibly accelerated gains should not surprise.


