MAR E-MINI S&P 500
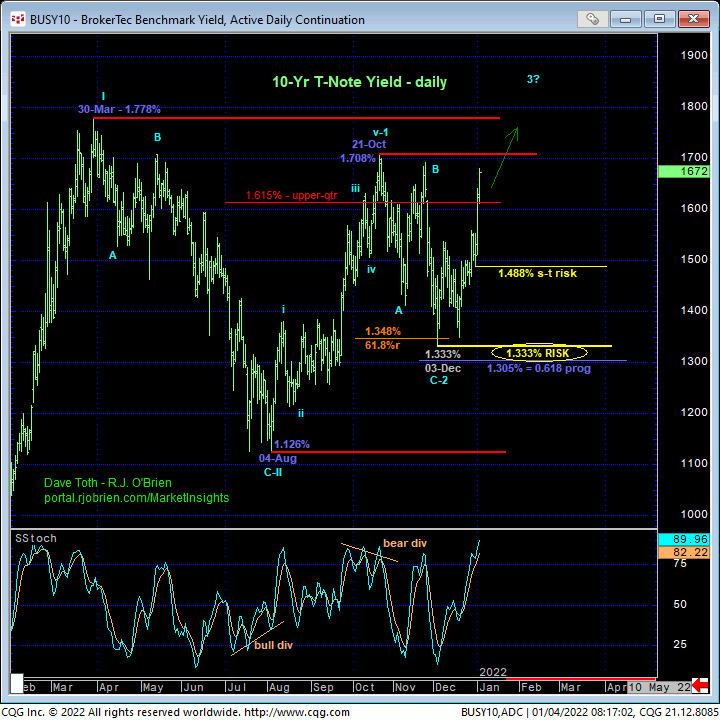
Overnight’s poke above last week’s 4798-to-4800-area resistance reaffirms the secular bull market and exposes a vast universe above the market totally devoid of any technical levels of merit. In effect, there is no resistance. The ONLY levels/areas of any technical merit at this juncture are former resistance-turned-support areas like 4800-to-4798 and prior corrective lows like yesterday’s 4747 low left in the wake of today’s resumed bull and 20-Dec’s 4520 larger-degree corrective low and key long-term bull risk. In lieu of weakness below at least 4747, the trend is up on all scales and should not surprise by its continuance or acceleration. In this regard, yesterday’s 4747 low is considered a very tight but objective mini risk parameter from which shorter-term traders with tight risk profiles can objectively rebase and manage the risk of a still-advised bullish policy and exposure.
To maintain the odds of a more immediate bullish count, the bull is now required to sustain gains above 4747. It’s failure to do so will break the uptrend from 20-Dec’s 4520 low. To be sure, such a minor momentum failure below 4747 would be grossly insufficient to suggest anything more than a slightly larger-degree correction within the secular bull trend. However, due to the extent and uninterrupted nature of Dec-20-to-Dec-28’s rally, there are NO levels of any prospective support below 4747 shy of 20-Dec’s 4520 low. So if one is of a risk profile in which risking bullish exposure to 4520 is too great, one’s only objective alternative would be to neutralize exposure on a failure below 4747. Concluding that some level between 4747 and 4520 will “hold” ahead of a resumption of the secular bull trend is somewhere between subjective/emotional and a hope-and-a-prayer and is outside the bounds of technical discipline.
Herein lies our rationale for identifying 4747 as an admittedly tight but objective risk parameter, the failure below which questions the risk/reward metrics of a bullish count enough for shorter-term traders to warrant at least paring bullish exposure, if not neutralizing it altogether in order to circumvent the depths unknown of a larger-degree correction or possible reversal lower. Better bein’ out, wishin’ you were in, than in, wishin’ you were out.
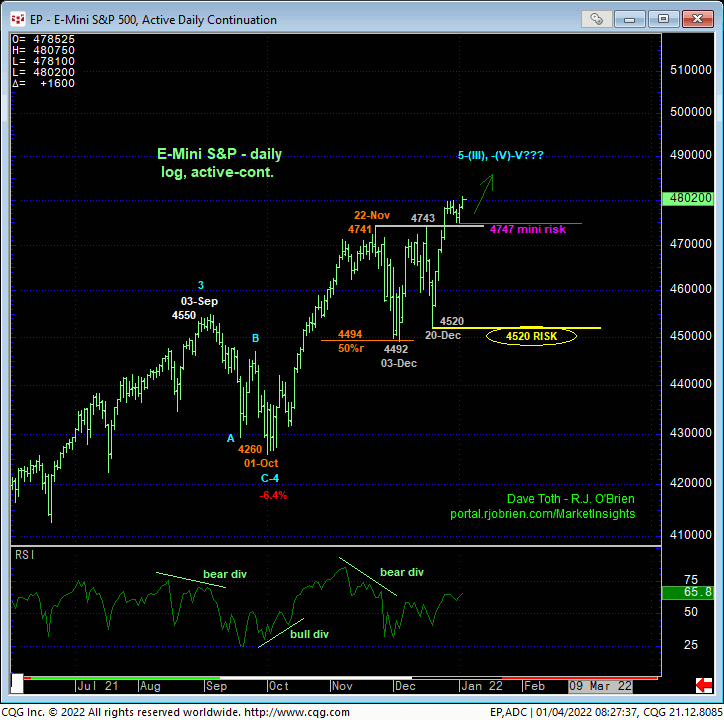
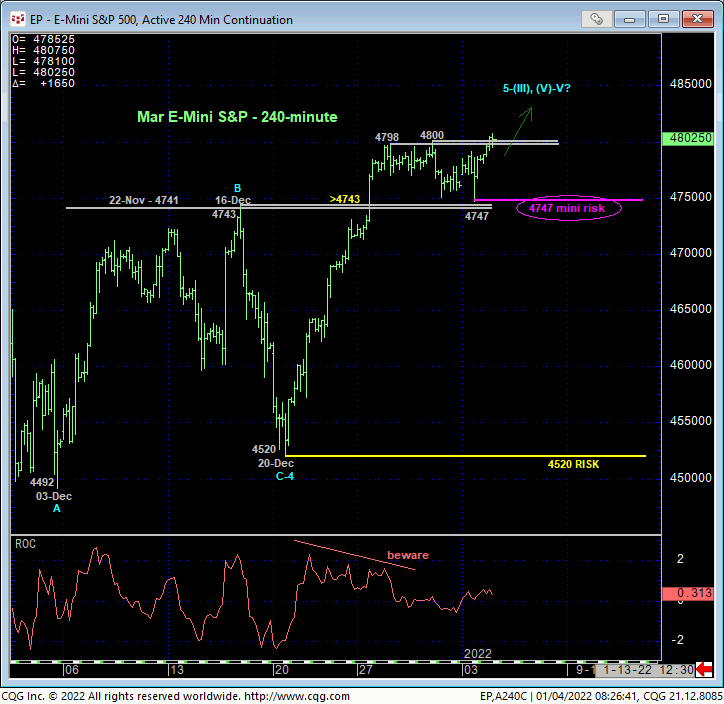
On a broader scale, the resumption of the secular bull trend is clear on both a daily scale above and weekly log scale below, warranting a continue bullish policy and exposure. On this broader scale, commensurately larger-degree weakness below at least 20-Derc’s 4520 larger-degree corrective low and key long-term risk parameter is required to even defer, let alone threaten the major bull. This 4520 level serves as our long-term risk parameter from which longer-term institutional players and investors can rebase and manage the risk of still-advised bullish exposure. A failure below 4520 would expose a peak/reversal threat that could be massive in scope.
In sum, a bullish policy and exposure remain advised with a failure below 4747 required for shorter-term traders to move to a neutral/sideline position and for even longer-term players to pare exposure to more conservative levels. In lieu of such weakness, further and possibly extensive gains remain expected. This said, traders are urged to keep close watch on momentum and the market’s ability to sustain trendy, impulsive behavior up in light of the past couple weeks’ sharp rise in Treasury rates that could easily derail the stock bull. We detail this rise in our 10-Yr T-Note analysis below.
MAR 10-YR T-NOTES
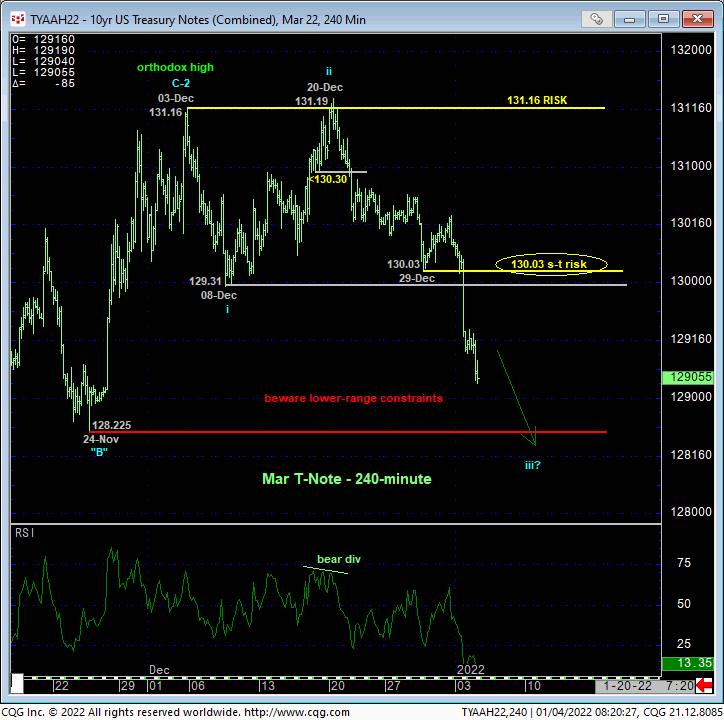
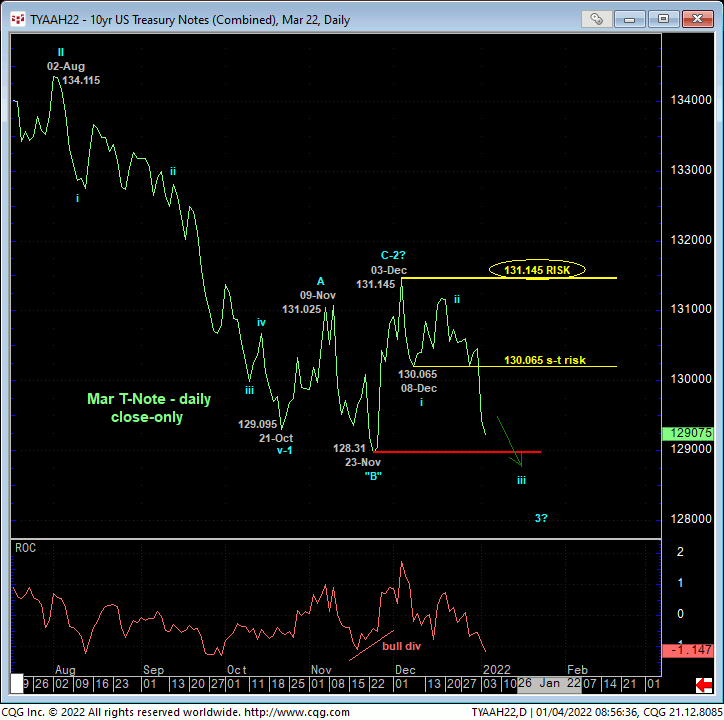
The 240-min chart of the Mar T-Note contract above and daily close-only chart below detail the past couple weeks’ sharp relapse that we believe defines 03-Dec’s 131.16 high (03-Dec’s 131.145 high daily close) as the orthodox end/top to a bear market correction from 21-Oct’s 129.095 low close as labeled below. These 03-Dec’s highs serve as our new long-term risk parameters from which a resumed long-term bearish policy and exposure can be objectively rebased and managed.
On a shorter-term scale, 08-Dec’s 129.31 low is considered a minor 1st-Wave of an eventual 5-wave sequence down to new lows below 24-Nov’s 128.225 low needed to reinstate the secular bear trend. With neighboring 29-Dec’s 130.03 level contributing to this area as a short-term but key former support-turned-resistance area and one that the market needs to recoup to jeopardize the impulsive integrity of a more immediate and possibly major bearish count, we’re defining 130.03 as our new short-term risk parameter from which traders can objectively rebase and manage the risk of a bearish policy and exposure.
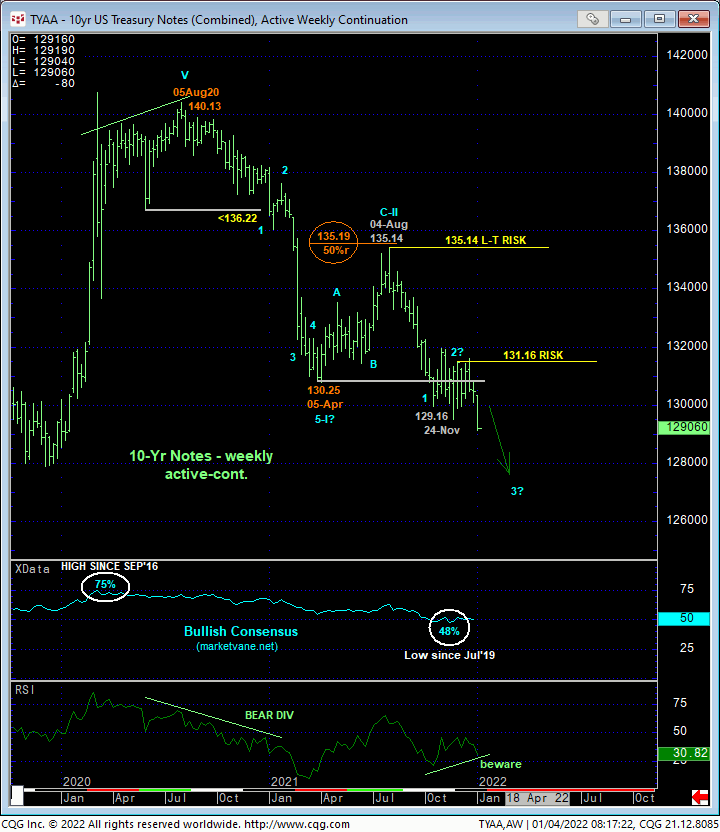
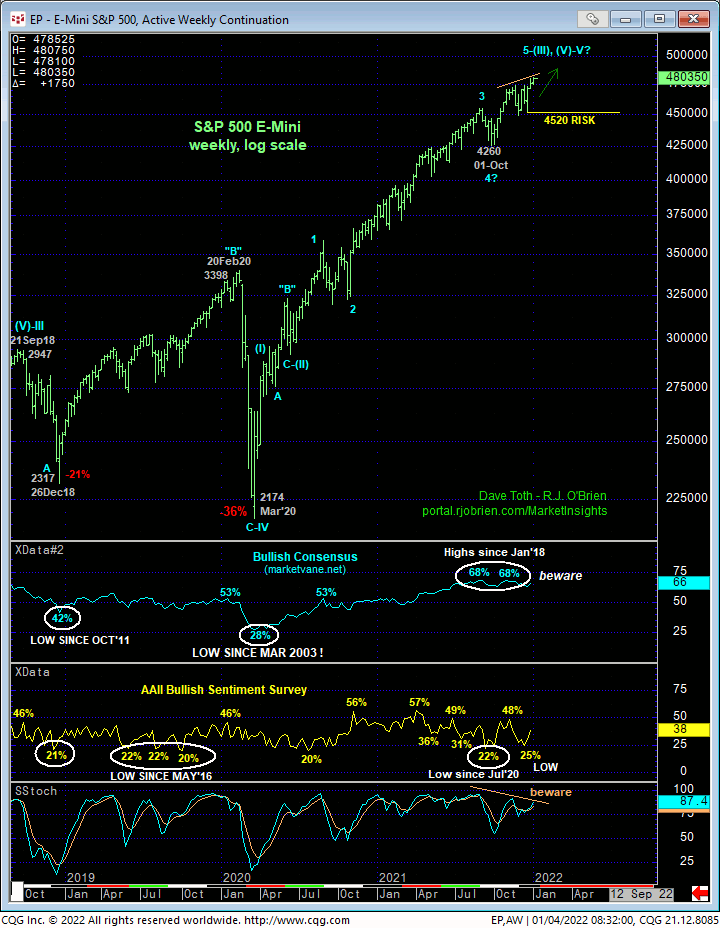
From a longer-term active-continuation basis, the weekly chart above shows this week’s resumption of the major bear market from Aug’20’s 140.13 all-time high. Looking at the daily chart of 10-yr yields below however, the market has yet to recoup even 21-Oct’s 1.708% high, let alone 30Mar21’s 1.778% high needed to reinstate the secular move higher in rates. This said, the extent and impulsiveness of the past few days’ rate rise renders Oct-Dec’s sell-off attempt a textbook 3-wave and thus corrective structure that warns of a resumption of Aug-Oct’s uptrend that preceded it to eventual new highs above 1.708%. And once above 1.708%, only 30Mar21’s 1.778% high stands in the way of a confirmed resumption of the secular move higher in rates.
Now, we can’t conclude that a resumption of the 17-month rise in 10-yr rates will result in the end of the secular bull market in the S&P. But a failure below yesterday’s 4747 low would provide a very early indication of an increased threat of such, reinforcing this admittedly minor corrective low as an effective risk parameter from which to pare or neutralize bullish exposure.
With respect to Mar T-Notes, a bearish policy and exposure are advised with a recovery above at least 130.03 required to defer or threaten this call enough to warrant paring or neutralizing exposure. In lieu of such strength and especially if the contract breaks 24-Nov’s 128.225 low, further and possibly extreme losses would be expected. And such conditions would warrant even closer scrutiny of the S&P market’s ability to sustain gains above 4747.
