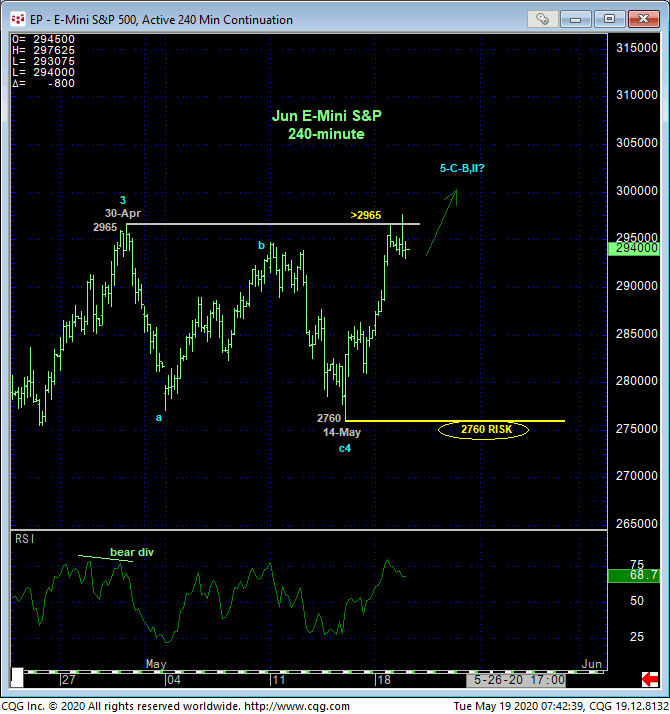
Overnight’s break above 30-Apr’s 2965 high and our short-term risk parameter nullifies the peak/reversal count discussed in Thur’s Technical Blog and chalks up early-May’s sell-off attempt as a 3-wave correction with Mar-May’s broader recovery as labeled in the 240-min chart below. These past three days’ rally defines Thur’s 2760 low as the end of that correction and new key risk parameter the market must maintain gains above to maintain a more immediate bullish count. Per such, this 2760 level serves as our new key risk parameter from which non-bearish decisions like short-covers and new cautious bullish punts can be objectively based and managed.


The crucial importance of Thur’s 2760 corrective low as a bull risk parameter is predicated on the facts that:
- upside momentum has been waning for over a month
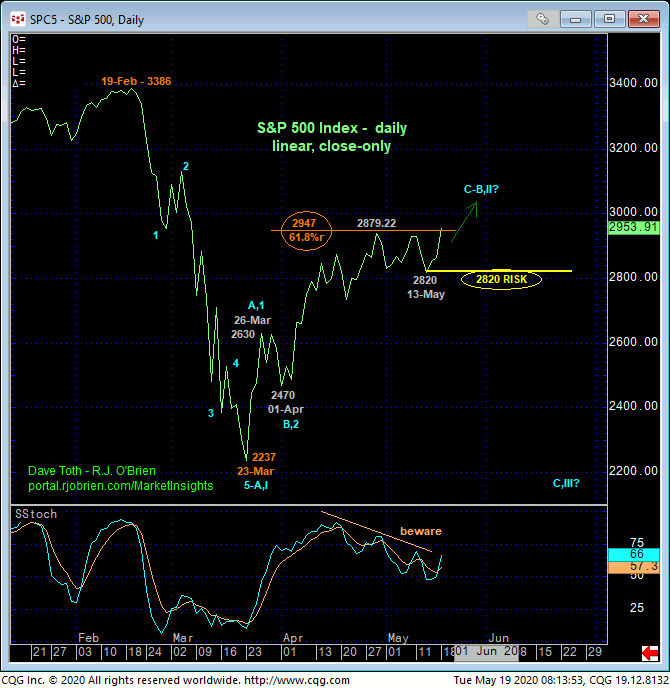
- Mar-May’s recovery remains in the area of the 61.8% retracements of Feb-Mar’s meltdowns in both the contract (above) and actual S&P 500 Index (below) and
- Mar-May’s recovery remains well within the bounds of a mere (B- or 2nd-Wave) correction within a massive peak/reversal-threat process.
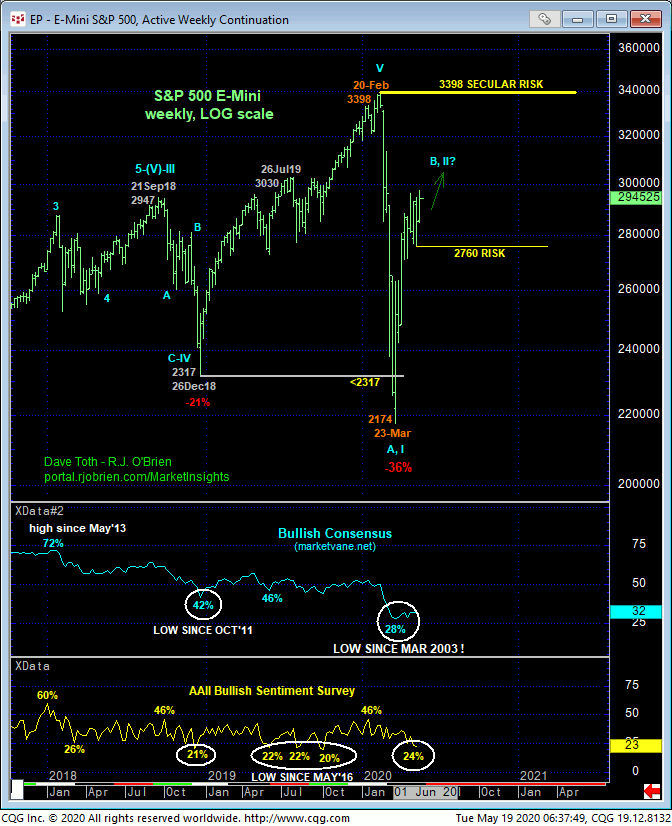
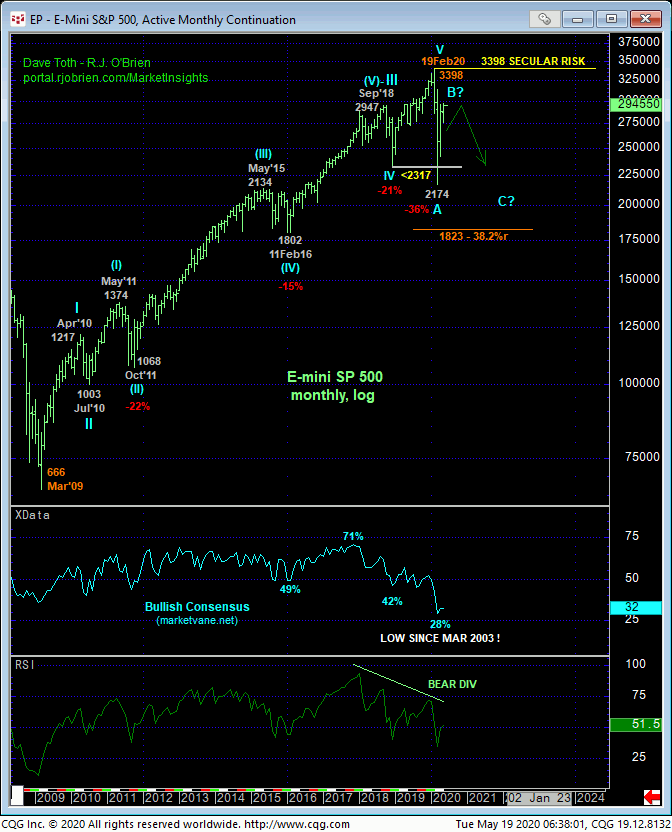
Indeed and for over a month, we’ve classified this 2900-ish area as a “rubber-meets-the-road” area that the bull MUST perform around threaten or negate the major peak/reversal threat brought on by Feb-Mar’s massive momentum failure that broke the secular bull trend dating back to Mar’09’s 666 low. This threat remains intact until and unless the market recoups 20Feb20’s 3398 all-time high. And only a glance at the daily charts here is needed to see that as impressive as the past couple months’ recovery has been, there’s a LOT of space between spot and that 3398 high. IF this major peak/reversal-threat count is wrong, then, quite simply, the bull needs to PERFORM “up here” with sustained trendy, impulsive behavior higher. A failure below 2760 would NOT be consistent with a bullish count, would break Mar-May’s uptrend and provide the first indication that that broader peak/reversal process is still intact. Until and unless the market fails below 2760, there’s no way to know high high “high” for this current rally.


The weekly (above) and monthly (below) charts show the massive and captivating nature of this year’s price action. And per the market’s bullish prospects, market sentiment/contrary opinion levels remain at historically depressed, bearish levels. The huddled masses are not “buying in” to the past couple months’ rally. This is a factor that reinforces a bullish count and highlights the importance of 14-May’s 2760 bull risk parameter.
These issues considered, our recommended bearish policy has been nullified. This begs the question of whether a cautious bullish policy should be considered “up here”. The answer is if one is OK with risk to 2760, then yes, a cautious bullish policy is fine. If not, then a neutral/sideline policy is recommended. And if the market fails below 2760, then we assure you we’ll be back on the bear board for what could be an extraordinary risk/reward play. Until and unless the market fails below 2760 however, further lateral-to-higher prices should not surprise.


