
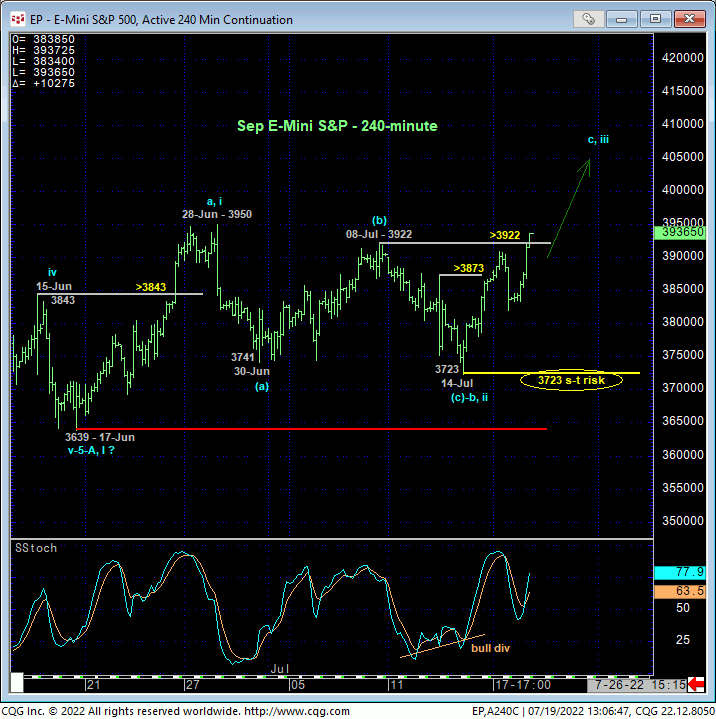
After whipsawing below 30-Jun’s 3741 low last week, the 240-min chart below shows the market recovering above 08-Jul’s 3922 high and our short-term bear risk parameter discussed in Thur’s Technical Blog. By recovering above 3922, the market has rendered the sell-off attempt from 28-Jun’s 3950 high a 3-wave and thus corrective event that warns of a resumption of mid-to-late-Jun’s uptrend that preceded it. Additionally and most importantly, this recovery above 3922 defines Thur’s 3723 low as the latest smaller-degree corrective low the market is now required to sustain gains above to maintain a more immediate bullish count. Per such, 3723 becomes our new short-term risk parameter from which non-bearish decisions like short0-covcers and cautious bullish punts can be objectively based and managed.
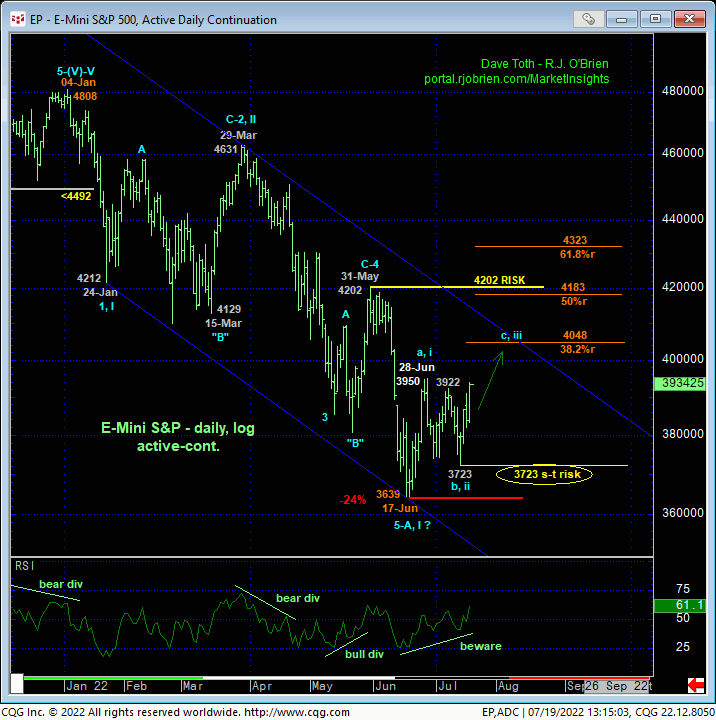
On a broader scale, rendering the sell-off attempt from 28-Jun’s 3950 high to last week’s 3723 low resurrects the prospects for a broader bear market rally we introduced in 24-Jun’s Technical Blog following that days’ bullish divergence in short-term momentum, an arguably complete 5-wave Elliott sequence down from Jan’s 4808 all-time high and the erosion in sentiment/contrary opinion levels low enough that they warned of upside vulnerability. The market is still wrestling with 3915-area resistance on a daily log close-only basis below, but given the extent of the past few days’ recovery that renders the sell-off attempt from 28-Jun’s 3950 intra-day high a 3-wave and thus corrective affair, we’re confident that this market will take out the 3915-to-3950-area resistance and expose a larger-degree correction higher. To nullify this count, the market has to break below 3723.
If 17-Jun’s 3639 low completed a 5-wave Elliott sequence from 04-Jan’s 4808 high, the correction of this decline could be “extensive” in terms of both price and TIME. We’ve noted the 38.2%, 50% and 61.8% retraces of Jan-Jun’s decline at 4048, 4183 and 4323, respectively. And if previous similar cases are any indication, a more extensive correction to the 61.8% retrace over the span of a month or two would hardly come as a surprise.
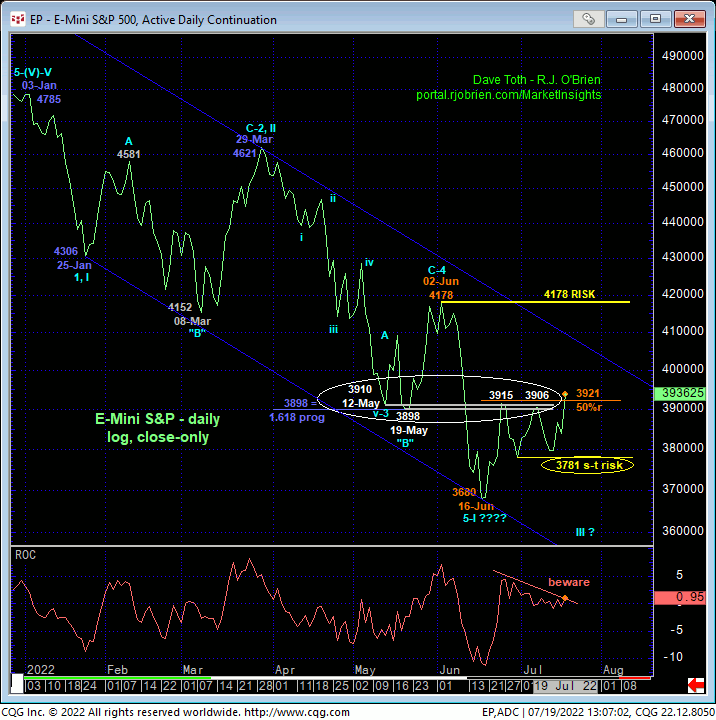
In the daily high-low chart above and weekly log chart below, we’ve noted 31-May’s 4202 larger-degree corrective high as THE level this market still is required to recover above to, in fact, break this year’s downtrend. And per such, we still have it labeled as a long-term bear risk parameter. The problem with this level is its practicality, even for long-term institutional players and investors. Making “non-bearish” decisions like short-covers back that deep into the middle of this year’s range is just impractical and suboptimal. Per such, we’re erring on the side of conservatism in our risk assumption and basically acknowledging and accepting whipsaw risk, back below 3723, for steeper nominal risk above 4202. Heck, if/when this market recovers to that 4202-area, we’ll be watching closely for a recovery-stemming bearish divergence in momentum to reset a long-term bearish policy and exposure.
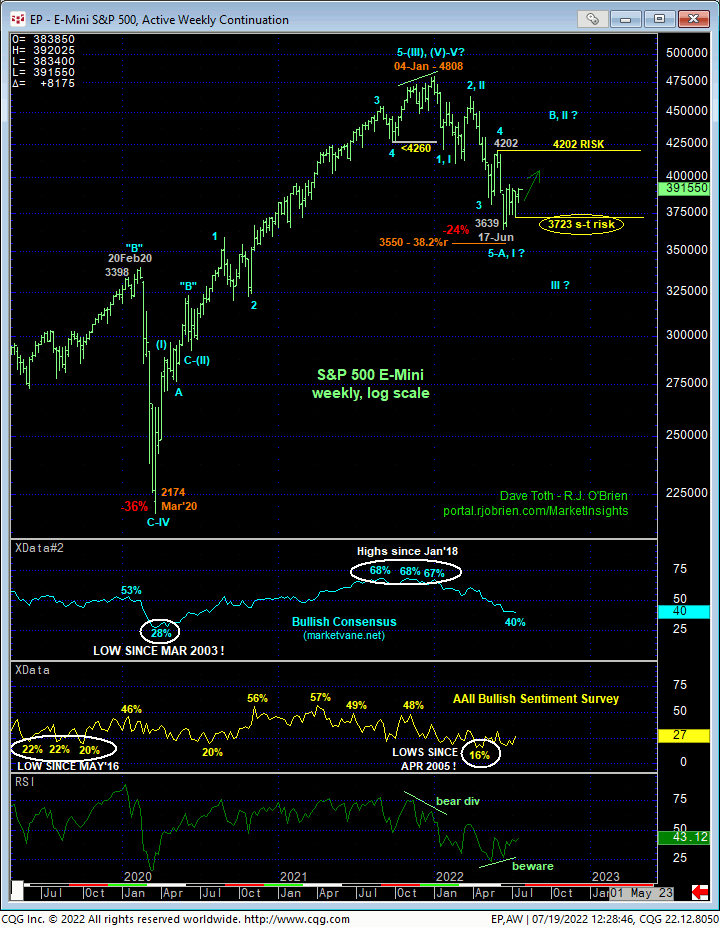
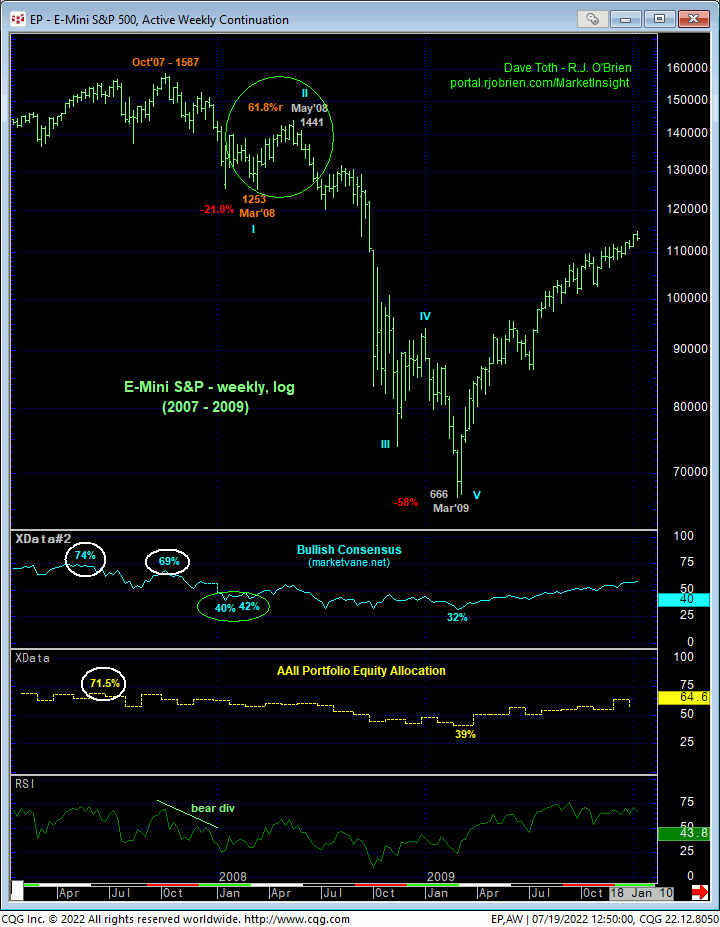
From a long-term perspective, we’d like traders and investors to consider Jan-Jun’s 5-1/2-month, 24% decline in the weekly log chart above to the virtually identical 5-month, 21% decline from Oct’07 to Mar’08 that stemmed from the same major momentum, sentiment, yield curve-flattening and Elliott Wave peak/reversal factors that we’ve been discussing since late-Jan. This INITIAL 1st-Wave only set the table for an “extensive” 2-month, 61.8% (2nd-Wave) correction WITHIN the massive peak/reversal process. After stemming that recovery attempt with another bearish divergence in momentum AND an “outside WEEK” the week of that correction’s high, the 3rd-Wave bottom fell out. THESE exact momentum and wave conditions are what we’ll be keeping a keen eye on in the weeks and perhaps months ahead. And again, a relapse below last week’s 3723 low will threaten such a bear market rally count and resurrect the major bear that could produce such a meltdown sooner rather than more accommodatingly later.
Finally, the quarterly log scale chart below shows the really long-term technical condition from the start of the year and similarity to the conditions that preceded the 1Q18-to-1Q20 correction and starts to both the 2007 and 2000 major bear markets. This price action includes an almost unheard of “outside QUARTER down” (higher high, lower low and lower close than 4Q21’s range and close). To negate this major peak/reversal/new bear market count, all this market needs to do is recover above Jan’s 4808 high. Until and unless such strength is shown, any recovery attempt, including a suspected extensive 2-month, 61.8% retracement will fall well within the bounds of a mere (2nd-wave) correction within a multi-quarter or multi-year bear market, the risk/reward opportunities of which will be extraordinary.
These issues considered, traders are advised to maintain or return to a cautious bullish policy and exposure ahead of a correction higher that could span another month or two and produce prices in the 4048-to-4323-range or higher. A failure below 3723 is required to negate this call and re-expose the major bear trend that would warrant resurrecting a bearish policy.


