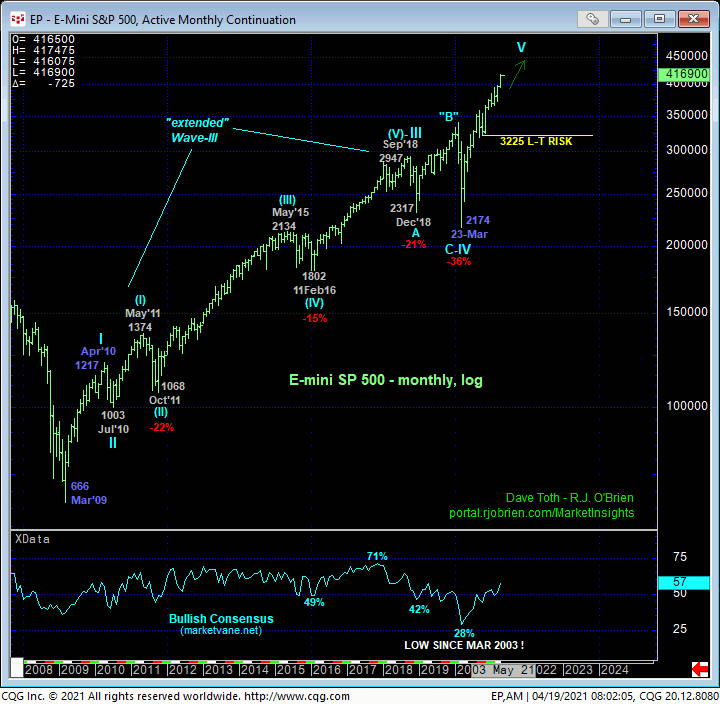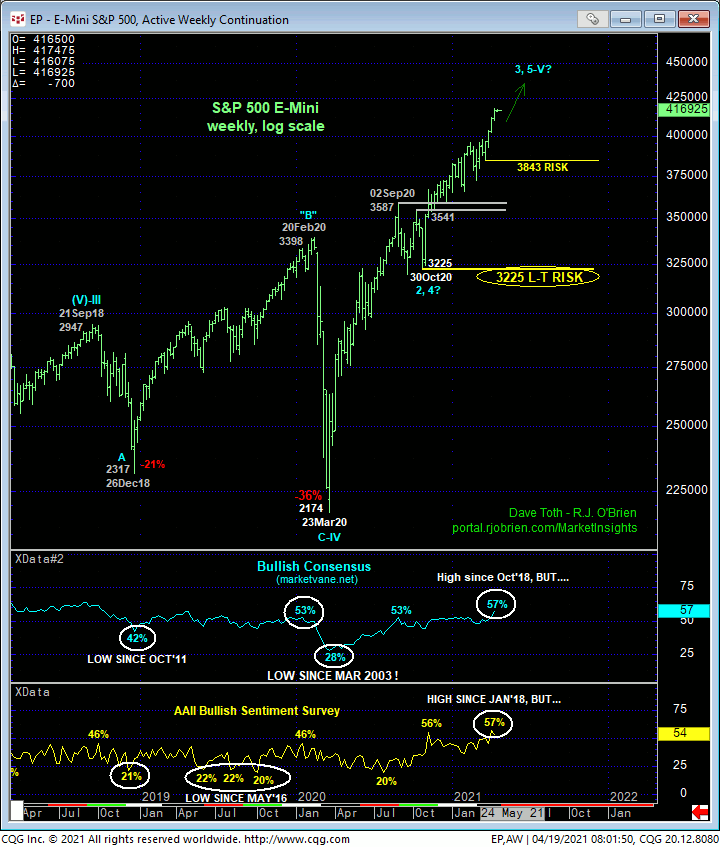

Only a glance at the monthly (above) and weekly (below) log scale charts is needed to see that the clear and present and major uptrend remains as THE dominant technical factors. The trend is up on all scales with no levels of any technical merit above it. In effect, there is no resistance as the market is trading at levels never seen before. The only so-called technical levels that exist above the market are “derived” from previous data points. And such derived levels like Bollinger Bands, imokus,, channel lines and even the vaunted Fibonacci progression levels we cite often in our analysis NEVER have proven to be reliable reasons to define resistance in the absence of an accompanying confirmed bearish (in this case) divergence in momentum. And they never will.
The only levels of any technical merit exist only below the market in the form of former resistance-turned-support and especially prior corrective lows the market is required to fail below to confirm bearish divergences in momentum.
In the weekly chart below, both sentiment/contrary opinion indicators we scrutinize closely have pinged levels not seen since at least Oct’18 that some may perceive as warning of a top. Sentiment/contrary opinion is a pivotal component of our analysis, but it is not applicable in the absence of an accompanying confirmed bearish divergence in momentum and will not inhibit further and possibly steep gains straight away.


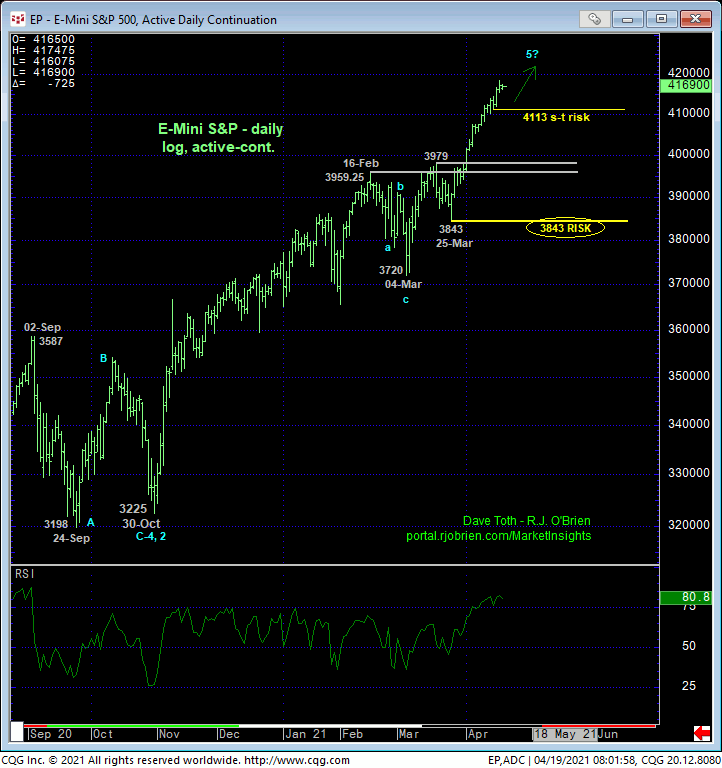
On a broader but yet practical scale, the daily log scale chart above still shows 25-Mar’s 3843 larger-degree corrective low as the MINIMUM level this market is required to fail below to break the uptrend from even 30Oct20’s 3225 low, let alone threaten the secular bull market. And key former resistance-turned-support around the 3960-to-3980-area stands between the market and that 3843 key long-term risk parameter.
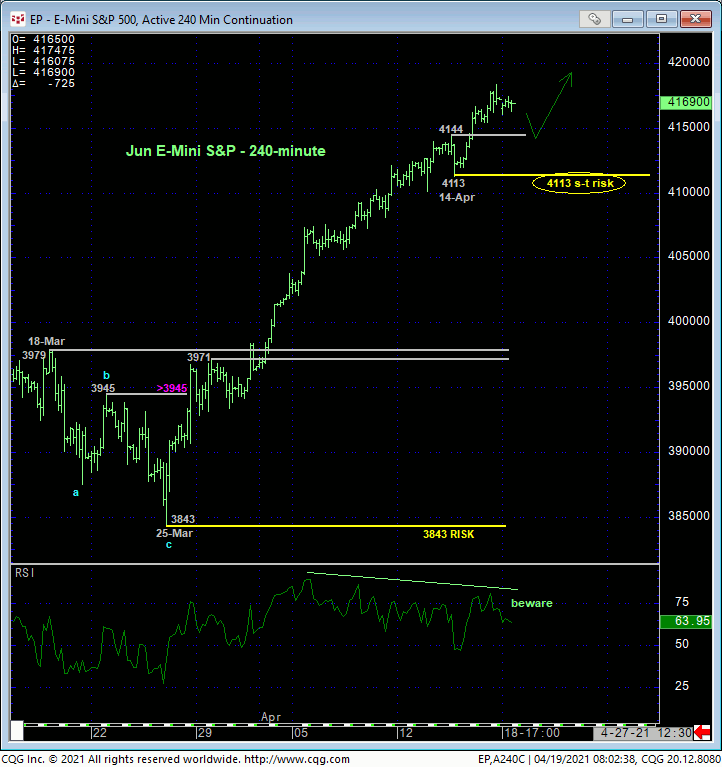
On a very short-term basis detailed in the 240-min chart below, Thur/Fri’s continuation of the bull above Wed’s 4144 high leaves Wed’s 4113 low in its wake as the latest smaller-degree corrective low the market is minimally required to fail below to confirm a bearish divergence in short-term momentum and expose even an interim corrective hiccup. For shorter-term traders with tighter risk profiles, this 4113 level may be used as a very short-term parameter from which the risk of a still-advised bullish policy and exposure can be objectively rebased and managed. In lieu of weakness below at least 4113, the trend remains up on all scales and should not surprise by its continuance or acceleration straight away.


