Posted on Aug 24, 2022, 08:28 by Dave Toth
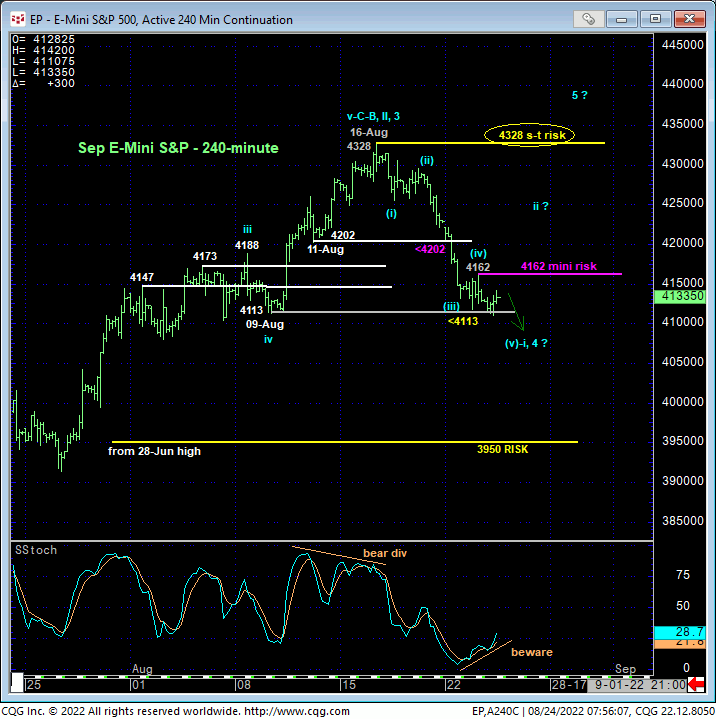
Since 15-Aug’s Technical Blog, we’ve discussed a couple short-term levels at 4202 and 4113 we believe the recovery from 17-Jun’s 3639 low needed to sustain above to maintain a broader, alternate bullish count. On Mon, the 240-min chart shows the market failed below 4202, confirming the very first, minor evidence of weakness that defined 16-aug’s 4328 high as one of developing importance and possibly the end to what we believe is a correction within a major peak/reversal process. Overnight, the Sep futures contract slipped below 09-Aug’s 4113 low, confirming another level of weakness and vulnerability that would be consistent with our major bearish count, reinforcing last week’s 4328 high as an increasingly pivotal one from which non-bullish decisions like long-covers, portfolio equity allocation reduction and cautious bearish punts can be objectively based and managed .
Last night’s continued erosion also left yesterday’s 4162 high in its wake as the latest smaller degree corrective high it is now required to sustain losses below to avoid confirming a bullish divergence in very short-term momentum that might complete a minor 5-wave sequence down from last week’s high and expose an interim (minor 2nd-wave) corrective rebuttal OR re-expose the broader recovery above 4328. So for shorter-term traders with tighter risk profiles looking to really fine-tune their positions around what could be a major peak/reversal count, yesterday’s 4162 minor high and mini bear risk parameter is a precise level around which to do so.

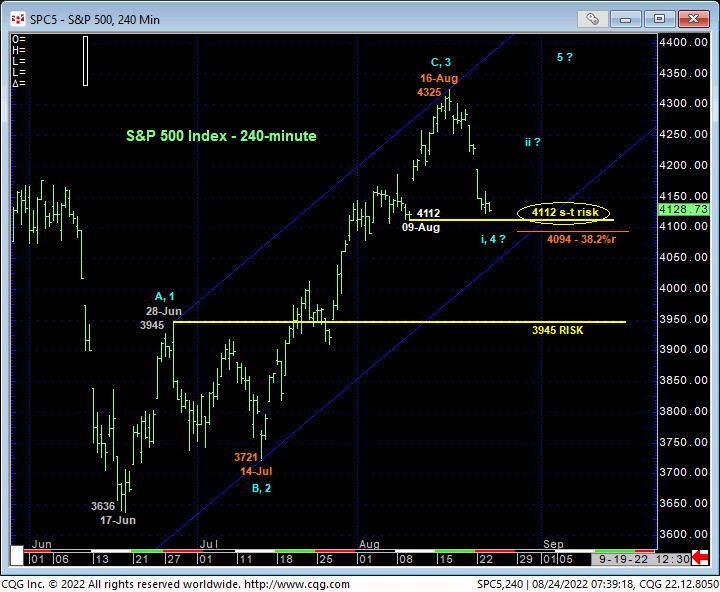
We specify the Sep futures contract above as well as yesterday’s 4162 minor corrective high because, basis the actual S&P 500 Index, which hasn’t open yet today, this analogous 4112 corrective low from 09-Aug has yet to be broken. This nuance is splitting hairs as the past week’s setback is clearly “enough” in terms of price and impulsive enough to contend that this decline is more than just a correction of the latest portion of the rally from that 4112 low. Minimally, the past week’s setback is a prospective (4th-wave) correction from 14-Jul’s 3721 low that has yet to retrace even a Fibonacci minimum 38.2% of this portion of the recent rally. Regardless of whether the cash index takes out 4112 or not, a recovery in the contract above 4162 would expose a (minor 2nd-Wave) corrective rebuttal to the past week’s break or possibly re-expose the now 10-week rally to levels above 4328.


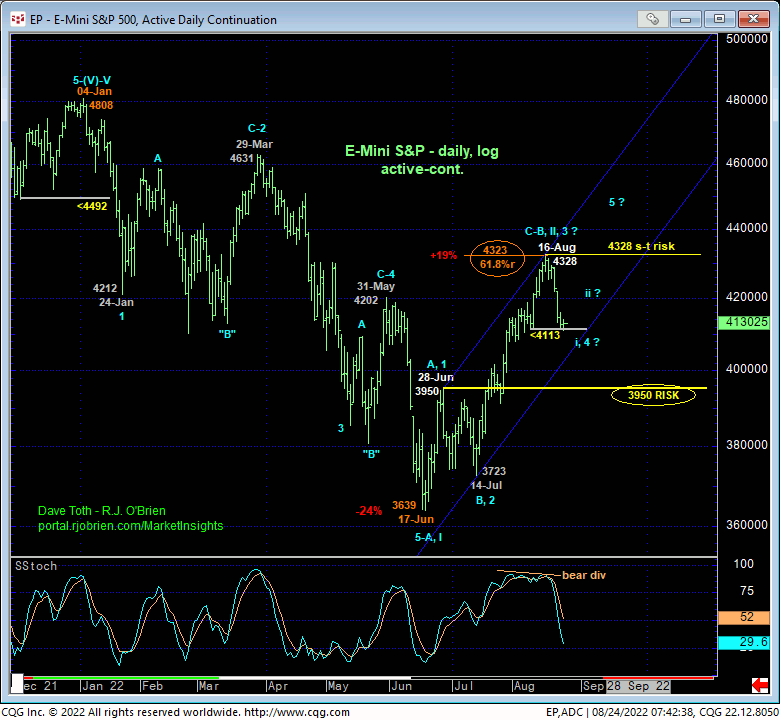
On a broader scale, overnight’s break below 4113 confirms a bearish divergence in DAILY momentum (above). This cements last week’s 4328 high as THE high and short-term but key risk parameter this market must now recoup to defer or threaten our major bearish count and reinstate the 10-week uptrend. Until and unless such strength is shown, and as we’ve discussed since late-Jun, the recovery from 17-Jun’s 3639 is easily considered a 2nd-Wave correction within a massive peak/reversal process from Jan’s 4808 high ahead of quarters or even years of a major bear market similar or perhaps worse than 2007 – 2009 and 2000 – 2002.
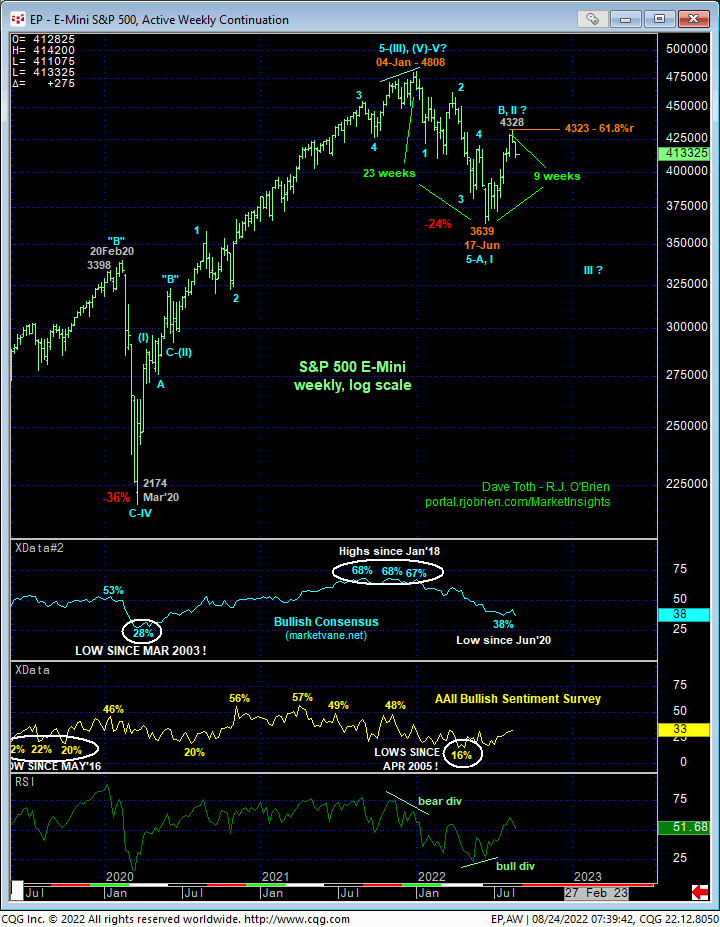
The exact 61.8% retrace of Jan-Jun’s 4808 – 3639 decline that also took exactly 38.2% (9 weeks) of the time it took for Jan-Jun’s 23-week decline to unfold contribute to this major bearish count. At this juncture, to defer or threaten this bearish count, the market needs to recover above 4328. On a major scale however, commensurately larger-degree weakness below 28-Juns 3950 high is required to confirm Jun-Aug’s recovery as the 3-wave and thus corrective structure needed to reaffirm the major downtrend. The market’s current position around 4130 is smack in the middle of these two key flexion points. And as it is still super early in such a broader bearish count, we strongly suspect there will be numerous interim corrective rebounds within the major downtrend. With respect to any excitable, emotional and headline meltdowns, we suspect this won’t occur until the market breaks 17-Jun’s 3639 low, which could easily be MONTHS from now.
These issues considered, traders are advised to pare bullish exposure further and/or maintain a cautious bearish policy until and unless the market recovers above 4328 that would warrant returning to a cautious bullish policy. A minor bullish divergence in mo above 4162 will arrest what we suspect is the past week’s initial minor 1st-wave dip and expose an interim 2nd-Wave corrective bounce to the approximate 4220-to-42450-area that, once stemmed by another bearish divergence in short-term mo, could present the holy grail of risk/reward opportunities from the bear side.


