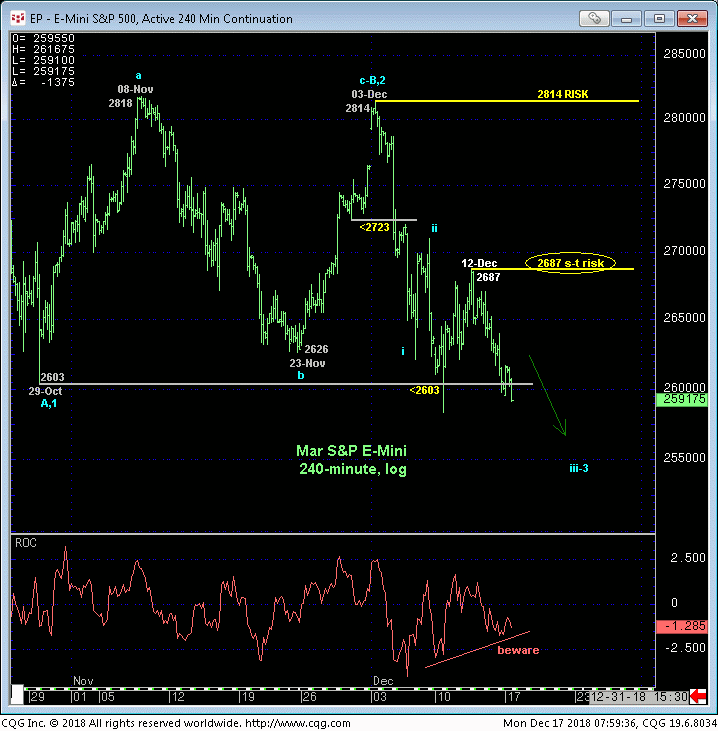
While the market hasn’t broken 10-Dec’s rogue 2583 intra-day low yet, we believe the extent of Fri/today’s relapse renders last Mon-to-Wed’s recovery attempt to Wed’s 2687 high a 3-wave and thus corrective event consistent with our broader bearish count. Per such we are identifying that 2687 high as our new short-term risk parameter this market is now minimally required to recoup to threaten a resumed bearish count that we believe could be major in scope.

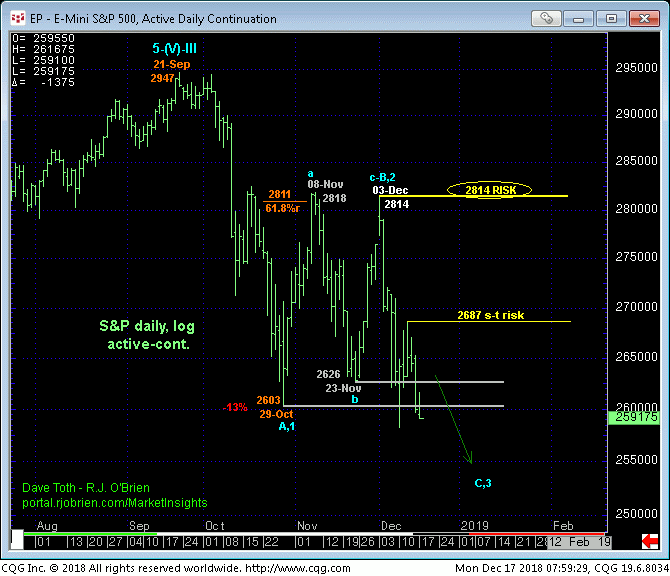
Last week’s relapse and resumption of early-Dec’s decline reinforces our broader bearish count that identifies the recovery attempt from 29-Oct’s 2603 low to 03-Dec’s 2814 high as a 3-wave and thus corrective affair that re-exposes Sep-Oct’s downtrend that preceded it. Commensurately larger-degree strength above 03-Dec’s 2814larger-degree corrective high is now minimally required to mitigate this broader peak/reversal count and re-expose the secular bull.
The threat here is that now that the market has resumed Sep-Oct’s downtrend, the market’s downside potential is indeterminable and potentially severe.

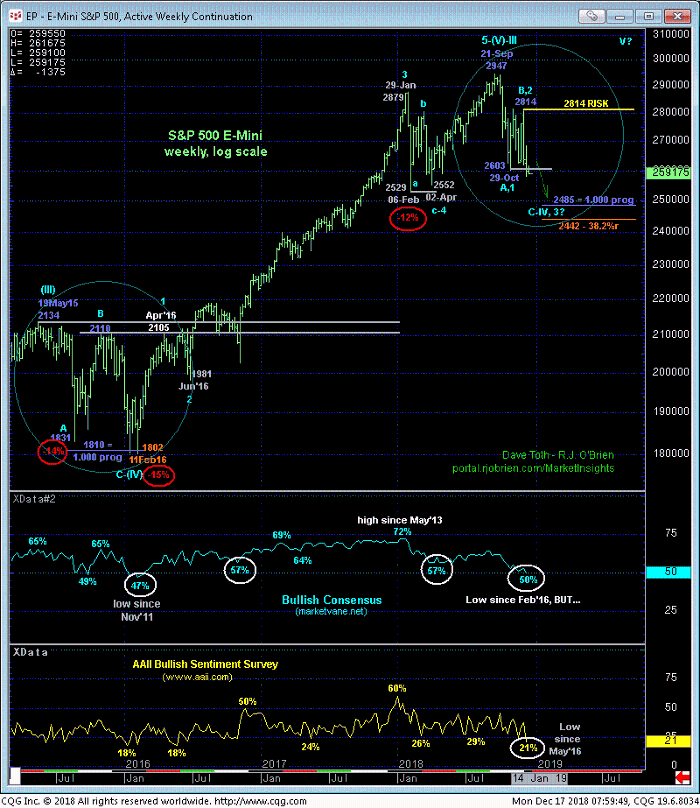
Possibly, looking at the weekly log chart below, the mid-to-lower-2500-handle-area that contained Jan-Apr’18’s correction will once again prove supportive, limiting the bear threat. But until and unless this market stems the clear and present downtrend with a confirmed bullish divergence in momentum- that requires a recovery above a prior corrective high like 2814 or even 2687- there is no way to RELY on any prospective support level to hold.
Other downside reference points are the (2485-area) 1.000 progression of Sep-Oct’s 2947 – 2603 decline from 03-Dec’s 2814 corrective high (an area that would also equate this correction to May’15 – Feb’16’s 15% correction) and also the (2442-area) 38.2% retrace of the complete 5-wave Elliott sequence from Feb’16’s 1802 low to 21-Sep’s 2947 high. But these levels too are advised to be taken with a grain of salt.

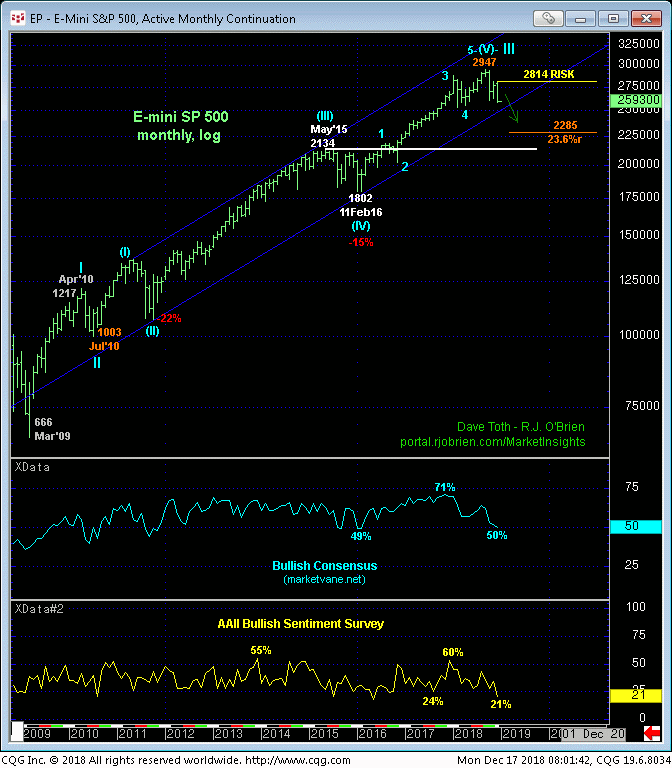
On a very long-term basis shown in the weekly log chart above and monthly log chart below, market sentiment levels have eroded to historically low levels that have warned of and accompanied virtually every major base/reversal environment in the past. And we have no doubt at all this these levels will warn of and contribute to the end of this current swoon and another outstanding risk/reward buying opportunity that will be of a much longer-term nature. HOWEVER, traders are reminded that sentiment/contrary opinion is not an applicable technical tool in the absence of an accompanying confirmed bullish (in this case) divergence in momentum. And such a confirmed mo failure, as always, stems from a recovery above a prior corrective high or an initial counter-trend high, neither requirement of which has been satisfied.
If we’re lucky, this correction is only correcting the bull trend from Feb’16’s 1802 low to Sep’18’s 2947 high. But there’s the prospect that this year’s 2947 high completed a much longer-term 5-wave Elliott sequence that dates from July 2010’s 1003 low as labeled in the monthly log chart below. And if this is the case, a multi-quarter correction to the 2300-to-2100-range would be quite feasible. We’re not forecasting such a correction, but until and unless this current slide is stemmed by a confirmed bullish divergence in momentum, there’s no objective way to eliminate ANY amount of downside potential, including a run at 2100.
These issues considered, a bearish policy and exposure remain advised ahead of further and possibly protracted losses straight away with a recovery above 2687 minimally required to even defer, let alone threaten this call and warrant countering decisions.


