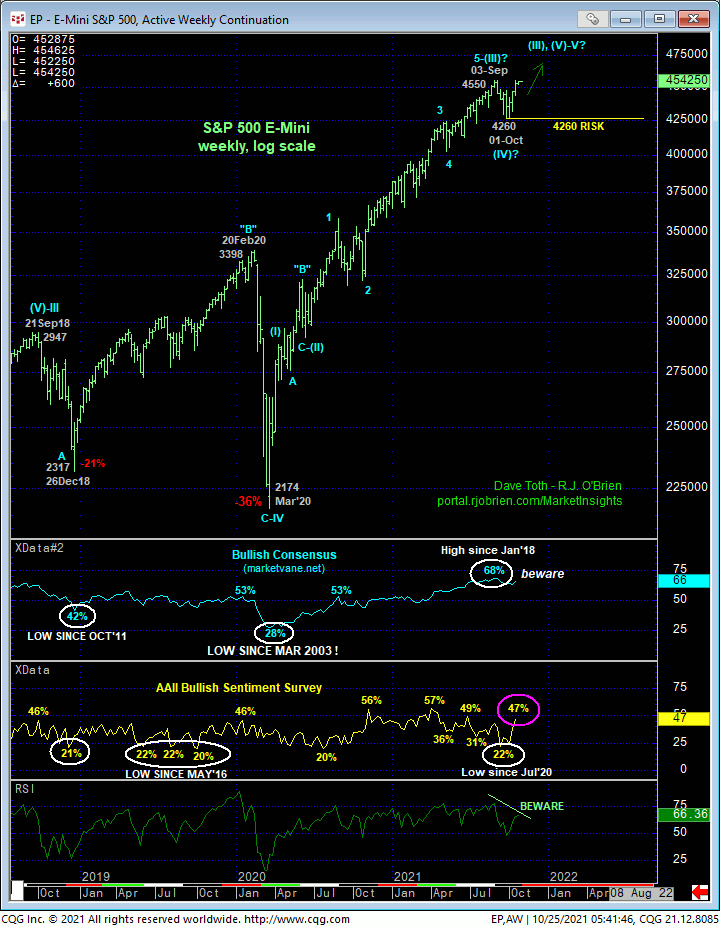
While the market only trickled above 03-Sep’s 4550 high on Fri and remains within the past couple months’ range that could still result in another intra-range relapse, the importance of the extent of last week’s rebound is that it reinforces 01-Oct’s 4260 as a key low and support from which a resumed long-term bullish policy can be objectively rebased and managed. In 20-Sep’s Technical Bog we discussed that day’s break below 19-Aug’s 4348 lager-degree corrective low that broke the longer-term uptrend, exposing a correction or reversal of indeterminable and potentially major scope. That weakness and subsequent weakness the following week left specific highs in its wake the market then needed to recover above to reinforce a count calling Sep’s swoon just another correction within the secular bull trend.
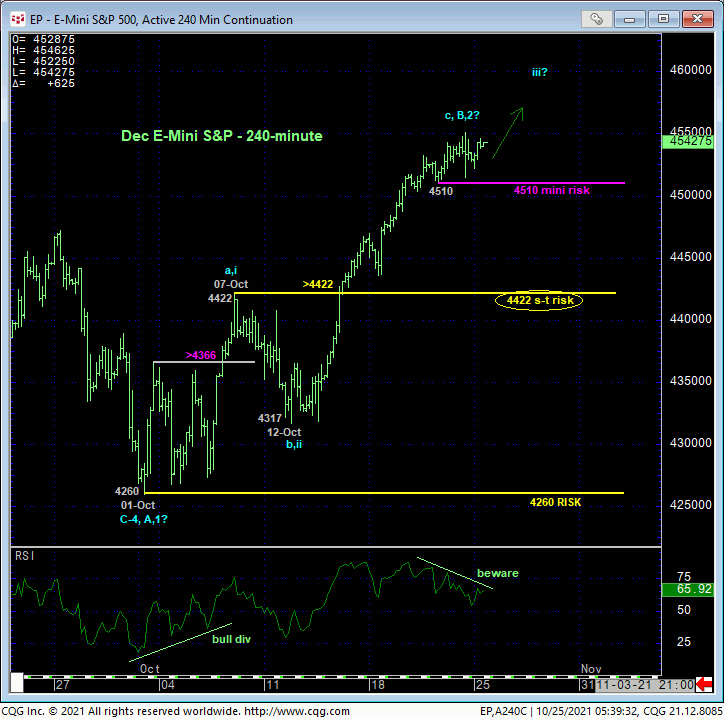
07-Oct’s bullish divergence in short-term momentum above 4366 discussed in that day’s Technical Blog provided the first smaller-degree but concrete evidence of a rejected/defied low at 4260 that threatened a broader bearish count and warned that Sep’s sell-off attempt might only be another correction within the secular bull trend. After surviving a smaller-degree corrective relapse from 07-to-12-Oct, the extent and impulsiveness of the recovery from 12-Oct’s 4317 low has confirmed the market’s weathering of another corrective sell-off attempt that, again, reinforces 01-Oct’s 4260 low as our new key long-term risk parameter from which longer-term institutional traders and investors can objectively rebase and manage the risk of a resumed bullish policy and exposure.
As the market has not yet blown away 03-Sep’s 4550 high area however, it remains indeterminable if 01-Oct’s 4260 low COMPLETED the correction or just defined its lower boundary ahead of further lateral chop in the weeks or months ahead whereby another intra-range swoon might still unfold. As is typically the case however, we will use MOMENTUM as the technical tool to navigate the market’s short-to-intermediate-term direction.

On a shorter-term basis, the 240-min chart below shows the past couple weeks’ impressive, impulsive rally where the portion of the rally from 12-Oct’s 4317 low is either the B-Wave of an intra-range consolidation that would have another interruptive relapse ahead OR the 3rd-Wave of an eventual 5-wave Elliott sequence that blows away 03-Sep’s 4550 high in a more obvious manner and reaffirms the secular bull. “Theoretically” (for what that matters), a failure below 07-Oct’s 4422 (prospective minor 1st-Wave) high is required to nullify a more immediate bullish count and render the entire recovery from 01-Oct’s 4260 low a 3-wave and thus (B-Wave) correction that would perpetuate the broader lateral range. As this risk parameter is back in the middle of the range, it lacks practical use.
“Up here” then, up against the extreme upper recesses of the two-month range and amidst the developing potential for a bearish divergence in short-term momentum, shorter-term traders with tighter risk profiles are advised to use Thur’s 4510 minor corrective low as a mini risk parameter, the failure below which would be cause to pare and neutralize bullish exposure and circumvent the depths unknown of another intra-range relapse. Until and unless such sub-4510 weakness is confirmed, further and possibly accelerated gains above Sep’s pivotal 4550-area highs and resistance should not surprise.


The matter of re-identifying corrective lows and bull risk parameters like 4260 from a long-term perspective remains crucial because of a number of factors:
- waning upside momentum on a WEEKLY basis above (CONFIRMED on a failure below 4260)
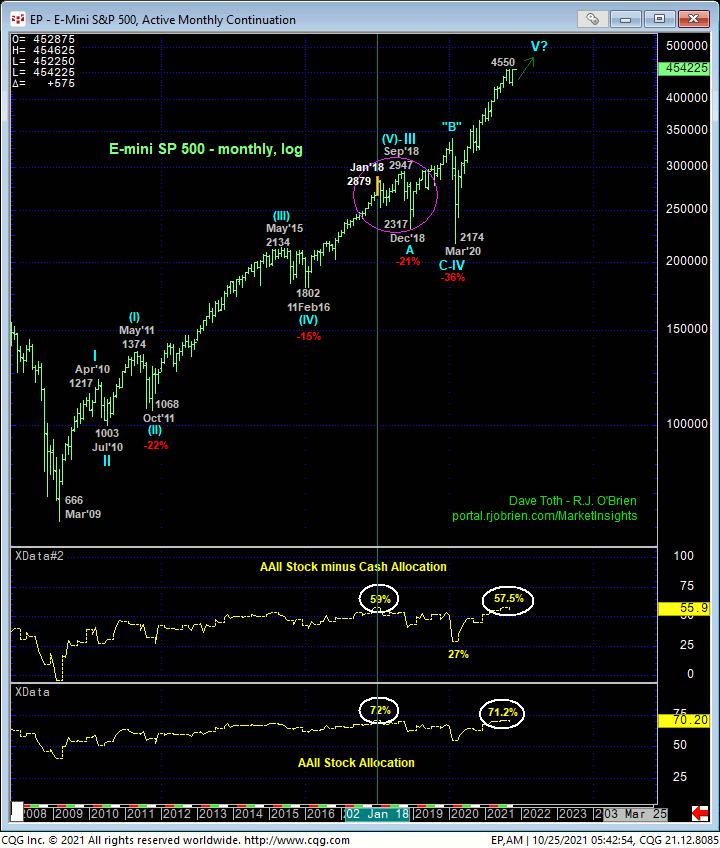
- the prospect that the market is at or near the end of a 5-wave Elliott sequence not only from Mar’20’s low labeled above, but also from Mar’09’s 666 low on a massive monthly log chart below
- historically frothy bullish sentiment levels that now includes the AAII Bullish Sentiment Survey
- continued upward pressure in interest rates (especially on the short end of the curve) and
- a base/reversal bid to gold from the lower-quarter of its year-long range consistent with our still-arguable secular bull trend count.
On a couple of these points and particularly with respect to market sentiment/contrary opinion, we’d like to point out the still-frothy levels in investors’ historic allocation to equities in their investment portfolios as the correlating stock-to-cash ratio shown in the monthly chart below. In recent months these levels have reached heights not seen since Jan 2018 and, prior to that, 2000. As always, sentiment/contrary opinion is not an applicable technical tool in the absence of an accompanying confirmed bearish divergence in momentum of a scale sufficient to threaten the long-term uptrend. A piddly mo failure below 4510 will not register in this regard, but a failure below 4260 absolutely would and would re-expose a major peak/reversal threat.
In the months following Jan-Feb’18’s 12% correction from 2879 to 2529, the secular bull trend resumed, sort of, with a 2% “breakout” above 2879 to a Sep’18 high of 2947. The market collapsed 21% in the final three months of the year in what we believe was a continuation of the correction that actually began with Jan’s 2879 high. The point here is that for the entire YEAR of 2018 amidst similar sentiment and longer-term momentum, the bull had a really tough go of it and ultimately succumbed to a 21% correction before resuming its long-term uptrend.
“Up here”, with the market pressing 03-Sep’s 4550 high and even with a more decisive bust-out above it, the clearest, simplest factor will be MOMENTUM and the bull continuing to BEHAVE LIKE ONE by sustaining trendy, impulsive behavior higher. The trend is, indeed, the bull’s friend and from here on out it’s required to continue to prove itself. Under such conditions and as we’ve detailed above and as we did whilst weathering Sep’s swoon, it’s not hard to identify the corrective lows and risk parameters the bull is required to stay above to continue to warrant a bullish policy and exposure. Following a decisive bust-out above 4550, the market’s upside potential is once again indeterminable and potentially extreme, warranting a continued or resumed bullish policy. An admittedly mini mo failure below 4510 will defer or threaten this call enough for short-term traders to step aside. Commensurately larger-degree weakness below 4260 is required for long-term institutional players and investors to once again take shelter on the sidelines. Until such weakness is proven, further and possibly accelerated gains should not surprise. But keep a keen eye on MOMENTUM.


