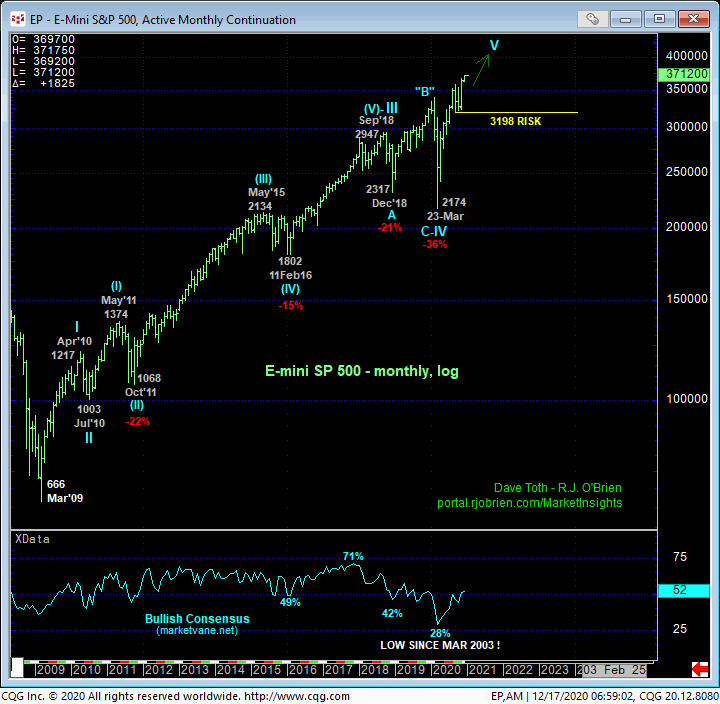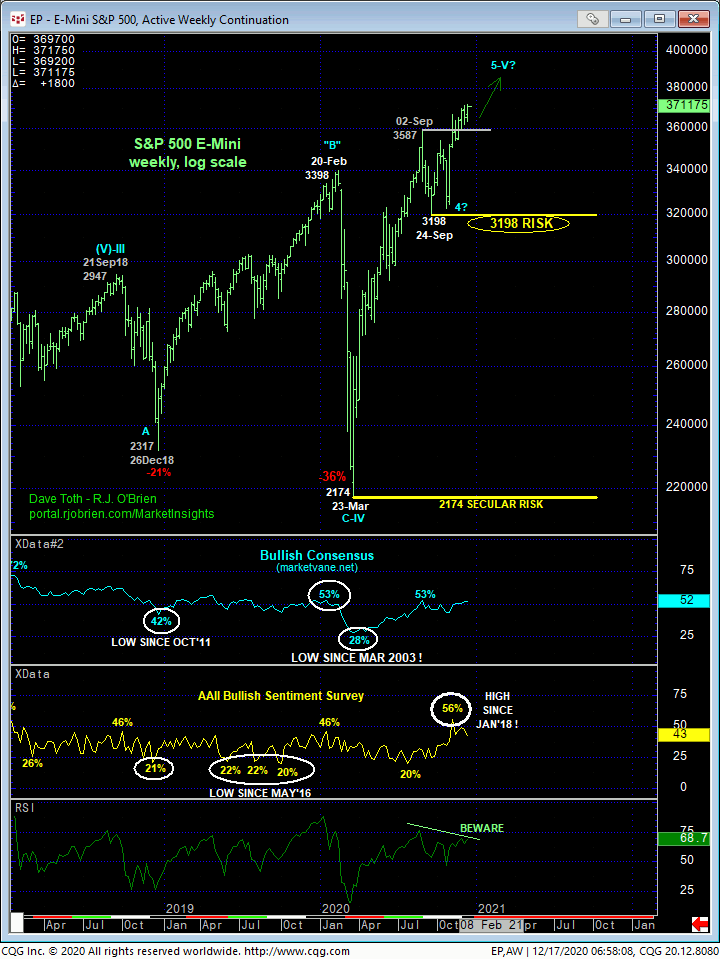

In what’s proven to be one of the worst years on record in one very important respect, it’s nice and comforting to know that the E-Mini S&P 500 market looks like it’s going t end this year on the highest of notes. Overnight’s break above 09-Dec’s 3715 high produced another all-time high, reaffirming and reinstating the secular bull trend. Knowing that this index is a LEADING indicator, this performance speaks well of the U.S. economy’s future, as long as it continues to sustain gains above previous corrective lows and risk parameters.
Indeed, only a glance at the monthly (above) and weekly (below) log scale charts is needed to see that the trend is up on all scales and should not surprise by its continuance or acceleration. On this major scale and for long-term investors, a failure below 24-Sep’s 3198 larger-degree corrective low remains minimally required to break even this year’s portion of the bull from 23-Mar’s 2174 low. Per such, this 3198 level remains intact as our key long-term risk parameter from which longer-term players can objectively base and manage the risk of a still-advised bullish policy and exposure.


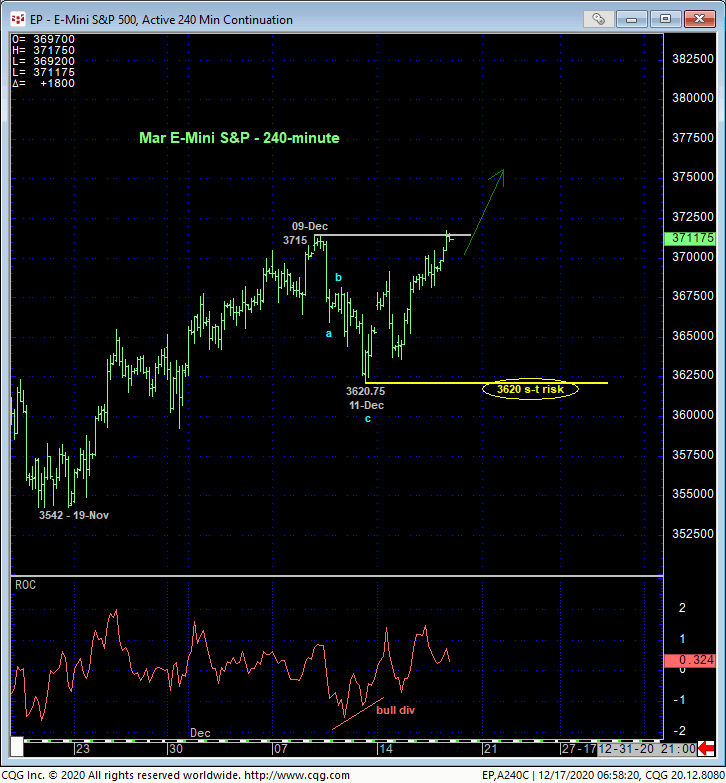
While the long-term bull trend is comforting however, it’s important and incumbent on us to maintain constant vigilance on threats to the bull in order to establish a defensive plan-of-action in the inevitable event of a larger-degree correction or major peak/reversal environment. For instance, the daily log chart above shows the developing POTENTIAL for a bearish divergence in momentum. A failure below 11-Dec’s 3620 smaller-degree corrective low won’t allow us to conclude the end of the rally from 30-Oct’s 3225 low, but it would expose at least an interim correction of relatively indeterminable scope worthy of defensive steps by shorter-term traders with tighter risk profiles.
There’s a goodly amount of former price action and resistance around the 3640-to-3550-area that, since broken, “should” hold as new support if/when the market fails below 3620. But ya never know. Below roughly 3550, there are NO levels of any technical merit to hold the market up shy of Sep-Nov’s 3225-to-3198-area key lows and support. For those who can’t risk bullish exposure to 3198- which would be a 14% drawdown from current 3717 all-time highs- paring or neutralizing bullish exposure on failures below 3620 and, subsequently, 3550 are your only objective options.
In sum, a full and aggressive bullish policy and exposure remain advised with a failure below 3620 required for shorter-term traders to pare or neutralize exposure in order to circumvent the depths unknown of at least an intermediate-term correction. Subsequent weakness below roughly 3550 would be further indication of weakness and vulnerability that would warrant further defensive measures. In lieu of weakness below at least 3620, further and possibly accelerated gains remain expected straight away.


