MAR E-MINI S&P
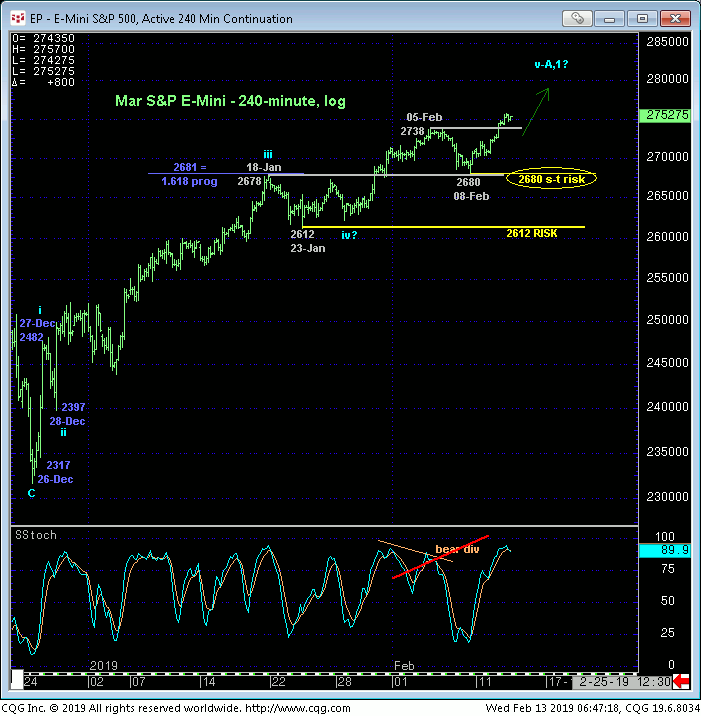
The market’s recovery yesterday above 05-Feb’s 2738 high and short-term risk parameter left in the wake of last Fri’s bearish divergence in short-term momentum discussed in that day’s Technical Blog nullifies that divergence, chalks up the relapse attempt as another correction and reinstates the uptrend from 26-Dec’s 2317 low. This resumed strength leaves last Fri’s 2680 low in its wake as the latest smaller-degree corrective low the market now needs to sustain gains above to maintain a more immediate bullish count. Per such this 2680 level becomes our new short-term risk parameter from which shorter-term traders can rebase and manage the risk of a resumed bullish policy.


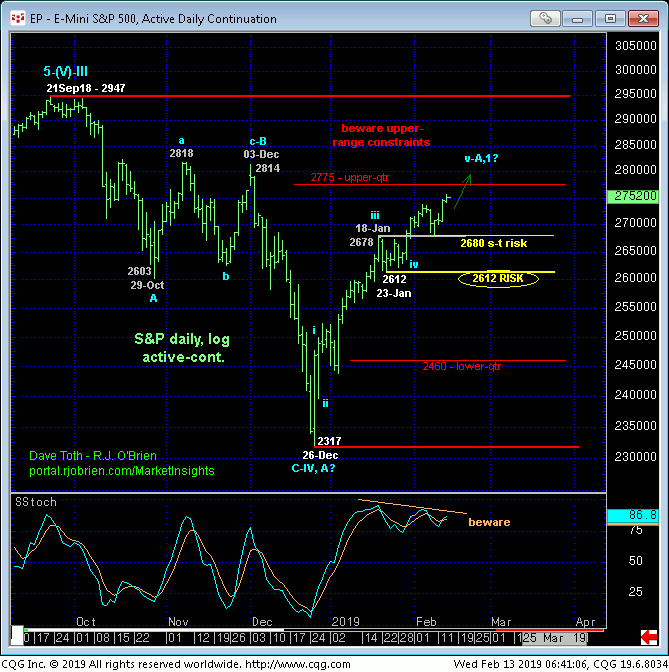
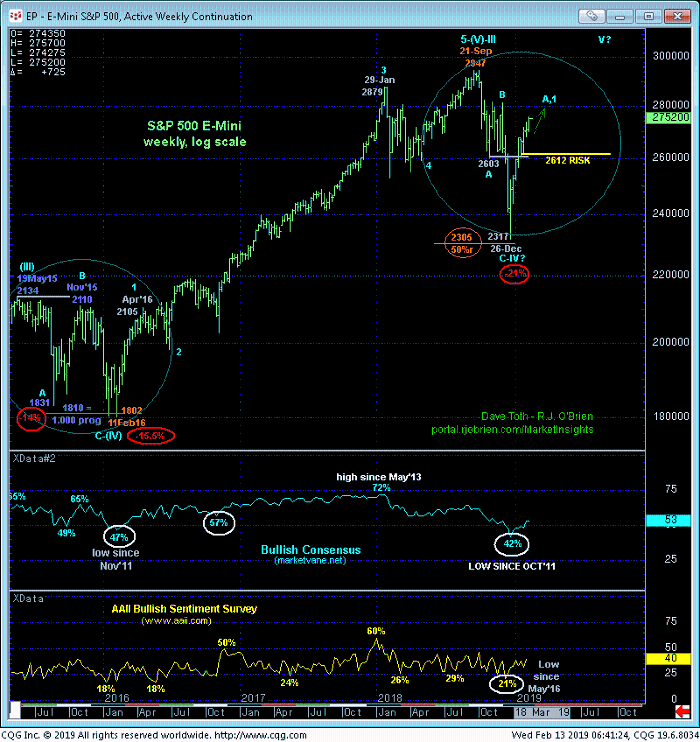
This tight but objective risk parameter and area of former resistance-turned-support at 2680may come in handy given the market’s encroachment on the upper-quarter of the 5-month 2947 – 2317-range shown in the daily log chart above and weekly log chart below. Given that the market remains within this range, we cannot ignore at all the deferred-bullish count that suggests this recovery is just a (B-Wave) correction of Sep-Dec’s decline ahead of an eventual (C-Wave) relapse back to the lower recesses of the range in the months ahead that would be expected to be sharp and emotional. The Nov’15-to-Feb’16 relapse circled in blue below shows exactly this type of technical condition and vulnerability.
By the same token, there’s no way to know at this juncture that 26-Dec’s 2317 low didn’t COMPLETE the correction and that the secular bull to new all-time highs above 2947 isn’t prepping to blast off in which should be an increasingly obvious, impulsive manner. Under such circumstances we would NOT expect this market to be failing below corrective lows like 23-Jan’s 2612 larger-degree corrective low and key risk parameter or even a smaller-degree corrective low like 2680.
These issues considered, a bullish policy remains advised for longer-term players with a failure below 2680 required to pare bullish exposure to more conservative levels and commensurately larger-degree weakness below 2612 required to jettison the position altogether to circumvent the depths unknown of a larger-degree correction lower. Shorter-term traders whipsawed out of bullish exposure following last Fri’s bearish divergence in short-term mo are advised to first approach setback attempts to former 2738-area resistance-turned-support as corrective buying opportunities with a failure below 2680 negating this specific count and warranting its cover. In lieu of at least such sub-2680 weakness, further and possibly accelerated gains are expected.


