The U.S. dollar Index has begun a major retracement that appears to be still in play. But the big news last week remains the U.S. stocks’ extended punishing selloff, which has now dragged them down to their worst week since the financial crisis, fuelled by mounting investor unease about the economic fallout from the coronavirus epidemic.
However, the commodity markets offer up some potential opportunities to benefit from any movements that may occur this week.
The White House appears to be focusing on further tax relief to encourage the market to rebound, though it is possible the market is more concerned about the non-financial issues this time around. This coming week we wait to see how the market responds following last week’s historic selloff.
Meanwhile, bonds enjoyed a large boost, which often occurs during market drops, indicating a possible shift towards safer havens.
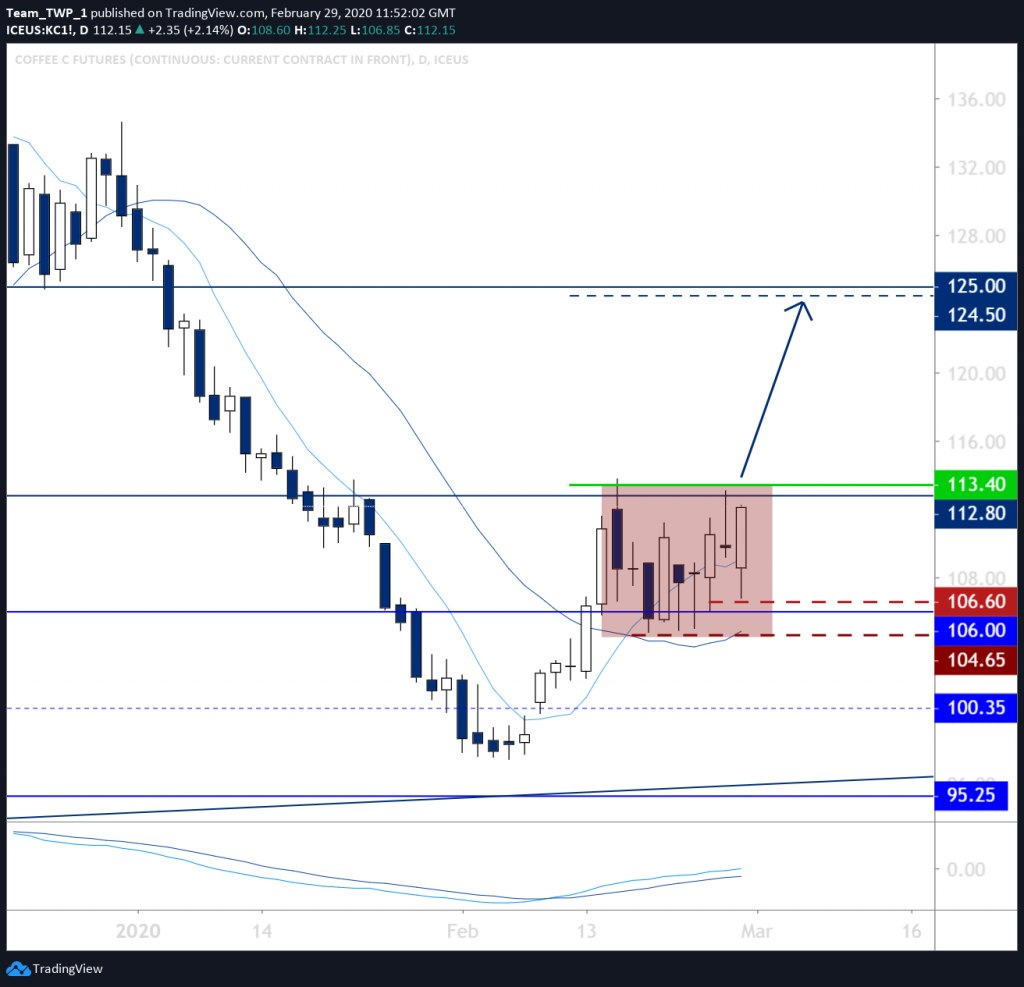
Coffee, Daily, Bullish
Coffee’s monthly, weekly, and daily charts are generally bullish, but with deeper than average retracements.
Price is currently consolidating within a small range between significant levels at 112.80 and 106.00 respectively.
The daily moving averages (MAs) have re-ordered into a bullish formation and price recently produced a swing-low from the area of equilibrium of these moving averages. It also found support on the Fibonacci 50% level.
The momentum indicator supports the bullish sentiment.
Should price break out of the consolidation to the upside, the next significant price level is located near 125.00.
An entry above the consolidation could be a safer option with a stop-loss placed either below the current bullish daily candlestick, or below the swing-low of the consolidation which is also below the S/R price level at 106.00. Profit could also be taken if price heads up towards the next key level, and potentially exited entirely just below the 125.00 S/R level
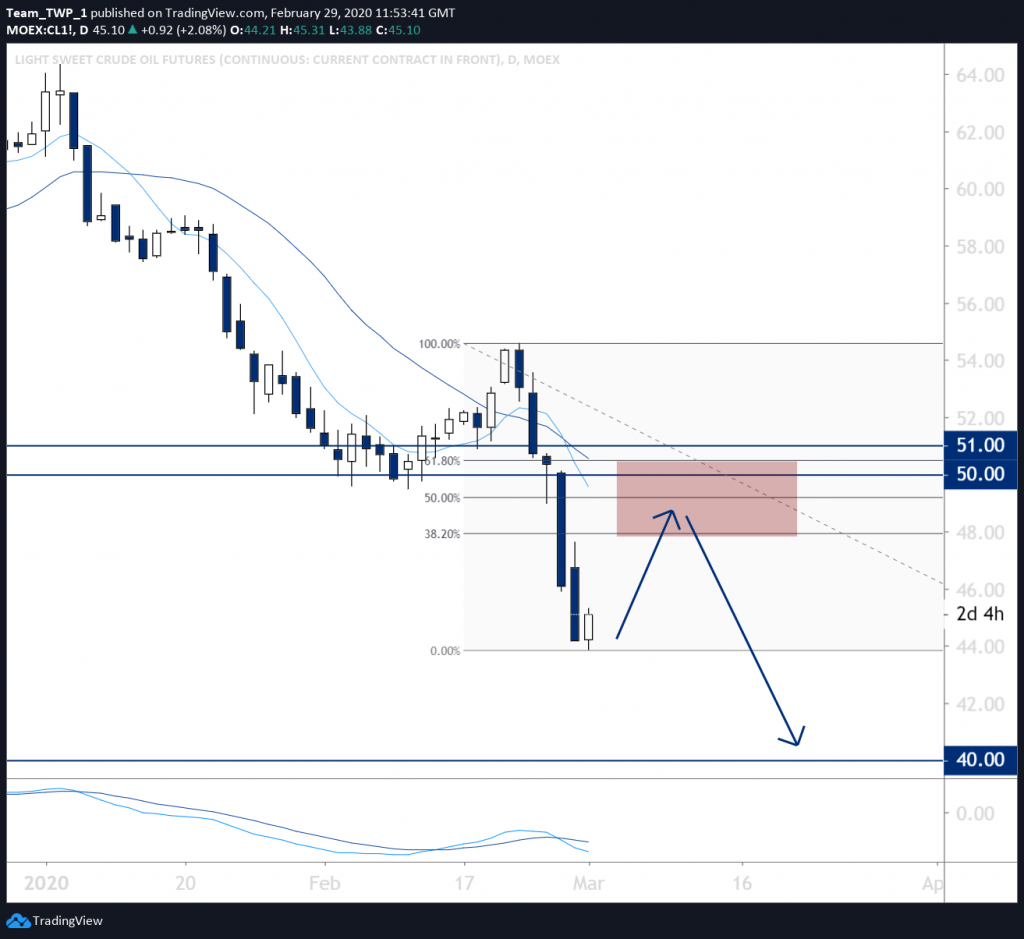
Light Sweet Crude Oil, Daily, Bearish
This chart has a monthly, weekly and Daily downtrend with lower-highs and lower-lows, as well as bearish momentum indicators on those timeframes.
Price broke down through significant historical levels at 51.00 and 50.00 and may retrace back up to test those levels as resistance, before heading lower again.
Should price retrace from its current location the area between the 38.2% and 61.8% Fibonacci levels will overlap with the moving averages and the 50.00 price level collectively offering potential resistance.
A bearish or bearish-rejection candle in this area may signify a possibly entry opportunity to join the new downward extension towards the 40.00 level.
A stop-loss placement above the 50.00 and/or 51.00 S/R level could add additional technical stop-loss protection.
Risk management will be key, so a stop-loss is imperative in order to protect capital exposure against unforeseen outcomes.