The U.S. indices enjoyed a large swing higher during the second week of April as the government’s stimulus bill spurned on market optimism. As key price levels hang above current price like potential concrete ceilings, so too does the prospect that there is a long road to travel for normality to resume in the markets as well as in our daily lives.
In the past week the US has continued to report historically high numbers of unemployment. It has also reported continuing shortages of medical supplies to key areas treating patients with COVID-19. Although the US makes up only 4.25% of the world’s population, it’s currently reported that we have 30% of the global COVID-19 infection cases.
While states taking the greatest precautions are showing a slight flattening of their infection rate curves, others that have not adopted such stringent social distancing measures, are likely to see a potential increase in numbers in the coming weeks.
With a vaccine reportedly not ready until 2021, the next best solution is to curb the spread through social distancing. The knock-on effect is the economy will struggle to recover, with workers being unable to return to their jobs.
The U.S. Dollar Index has swung in both directions, whip sawing around the 100.00 level, with no clear trend in place. It will be of interest to traders to see if this level will hold this week.
Wednesday and Thursday this week will see the release key US retail sales figures, and Jobless claims respectively, all of which could impact sentiment.
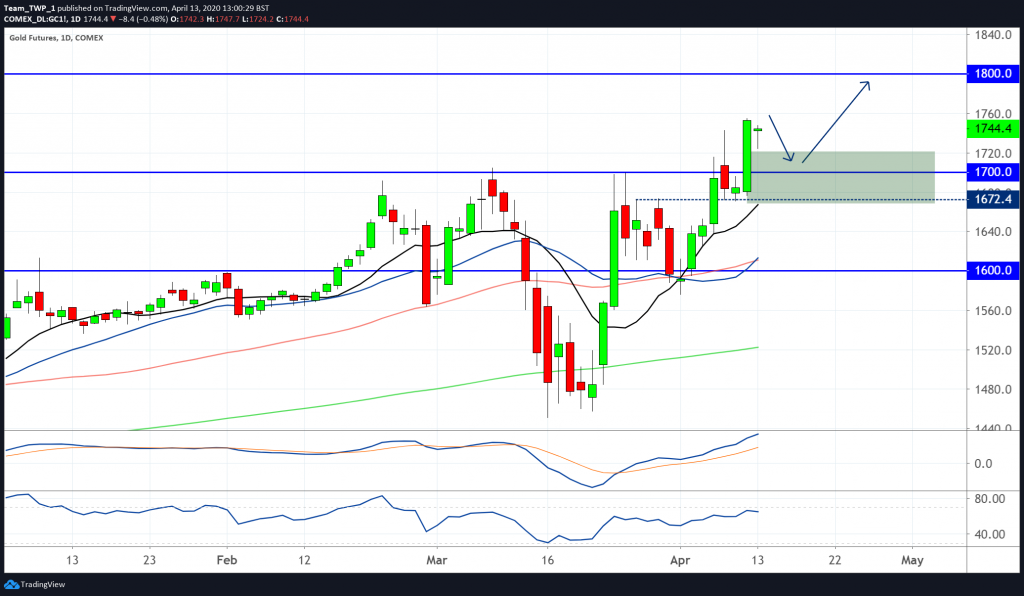
Gold, Daily, Bullish.
The monthly, weekly and daily charts show up-trending higher-highs and higher-lows.
The moving averages (MAs) are in a bullish order and angle, supported by bullish momentum indicators.
Price has recently broken resistance at $1,700 and may retrace back down to the level to test it for support, as well as find equilibrium in the area between the 10 & 20 period moving averages (MAs).
The area highlighted in green on the chart represents the potential location for buying should price action pull back into this zone. Target buying opportunities between $1,672 and $1,700.
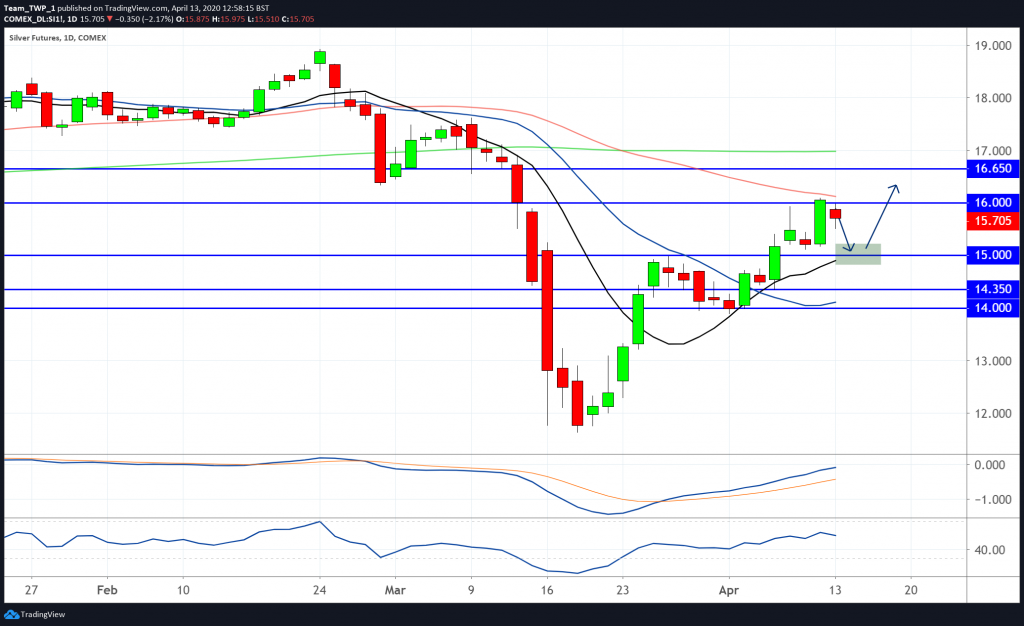
Silver, Daily, Bullish.
The monthly, and weekly charts have generally been heading lower on Silver, and so it is possible that the longer-term trend may maintain its bearish momentum.
However, the daily chart is trending higher and has recently broken up through significant resistance. The momentum indicators are also bullish in sentiment.
Price may retrace back down to the 15.00 level to test it for support, as well as find equilibrium in the area between the 10 & 20 MAs.
The area highlighted in green on the chart may represent good buying areas should price action pullback into this zone. Target buying opportunities between $14.70 and $15.
During periods of increased volatility, a reduction in standard account risk could be considered. Taking profits if the moves are in the prevailing direction may mitigate risk further. Risk management will be key, so a stop-loss is imperative, in order to protect capital exposure against unforeseen outcomes.