

With the continued threat of the global COVID-19 epidemic, which experts now believe will last for the remainder of 2020, the U.S. economy has continued to produce a mixed bag of results depending on the area being studied.
The market sentiment for the U.S. Dollar, the U.S. Indices and the Commodities; Gold and Oils remains bullish. Wednesday revealed a worse-than-expected inventory in Crude, possibly causing the strong boost resulting in a bullish weekly candlestick off of support levels.
The coming week will produce figures for manufacturing results for various economies as well as the U.S. and EU monetary policies. Any changes are not expected to be unusually volatile in any way.
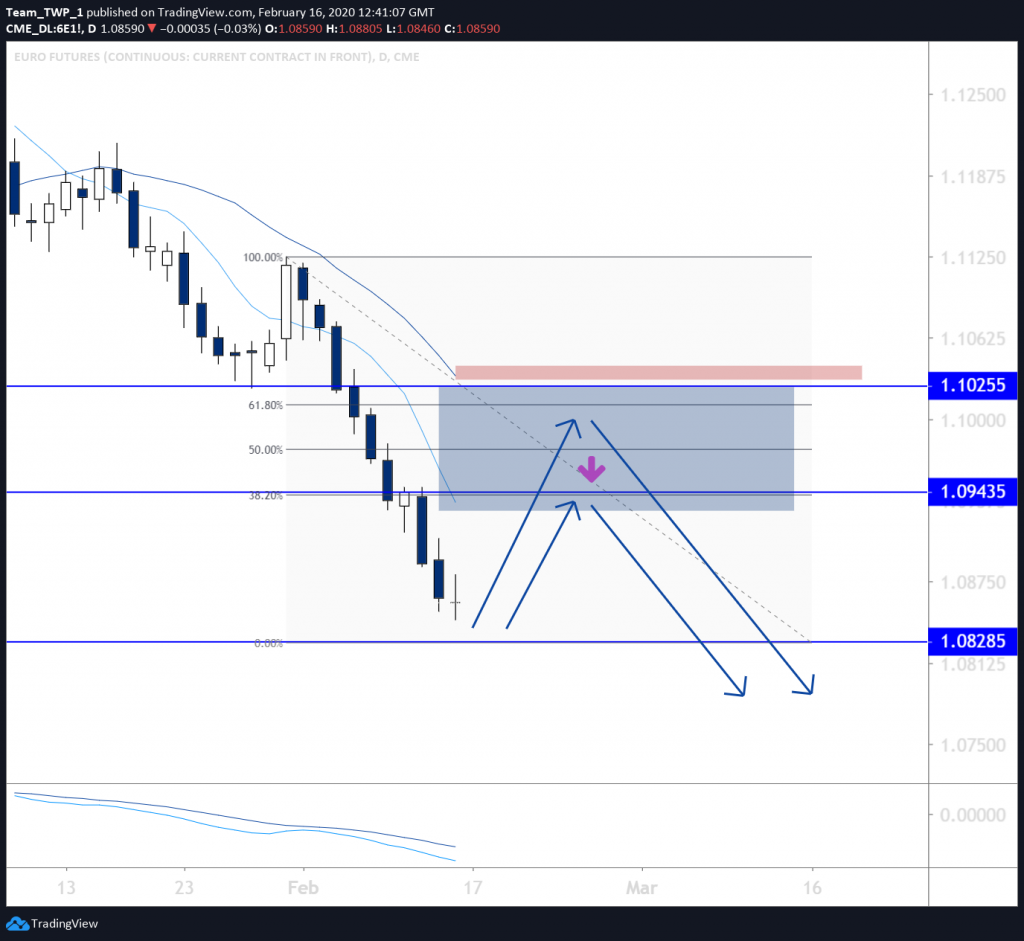
EURO Futures, Daily, Bearish
The Euro is currently under pressure from most of its trading partners which is evident on the Monthly and Weekly charts where a downtrend with lower lows and lower highs is evident. The Weekly chart is technically over-extended and possibly due for a retracement. The Daily chart adds to this likelihood as price action is very much over-extended compared to recent behaviour and its distance from the simple 8 and 21 moving averages.
The Daily trend itself is steady and consistent in its movement implying a clear dominance of the bears over the bulls.
Price is increasing in its likelihood of retracing back into the 8 & 20 moving averages as well as a potential overlap of a key historic resistance level and/or multiple Fibonacci levels.
Two key levels offer possible retracement targets aside from just the moving average ‘zone’ (the area in and around the two moving averages), a 38.2% near 1.0950 and the 61.8% Fibonacci level near the 1.1000 level.
Price may react to resistance at either of these two levels and ideally produce a small or small-medium sized bearish candlestick in this area. Should this overlap with the sell-zone area of the moving averages an entry into the new extension in the direction of the prevailing trend could be an elegant entry opportunity.
The area above the 1.0950 or 1.1000 levels depending on the location of the future candlestick could offer additional stop-loss protection. Stop-losses offer crucial protection against unforeseen changes in market conditions.
The next key level sits closer to 1.0830. This level could act as a potential target for price should it resume if trend after the retracement. Taking profits as price moves in favour of the trade could help mitigate risk.
U.S. Dollar Index, Bullish, Daily
Price action on this instrument continued its bullish momentum without a retracement in the previous week, but still offers potential, if not increased likelihood of retracement in the near future, and which could offer an entry into a strong trend before resuming a renewed move to the upside.
Key horizontal levels can be identified at or close to 99.00 and 99.30, and should price retrace from either of these levels, then levels close to 98.30 and 98.00 offer attractive targets for a healthy retracement. These levels also overlap with dual Fibonacci retracement measurements. A 38.2 and 50% level overlaps close to 98.30, while a 50% and 61.8% level orbit close to 98.00. These overlaps can include a higher density of possible fill orders and therefore may impact price and cause it to find support.
Price action may produce a small, or small-medium sized bullish candlestick that demonstrates support at either of these levels, offering an elegant entry opportunity. In terms of risk management, a stop-loss placed below the low of the candle and/or the 61.8% level could offer technical protection, while an entry above the high of the future candlestick may be the efficient entry if price subsequently follows through by breaking higher.
