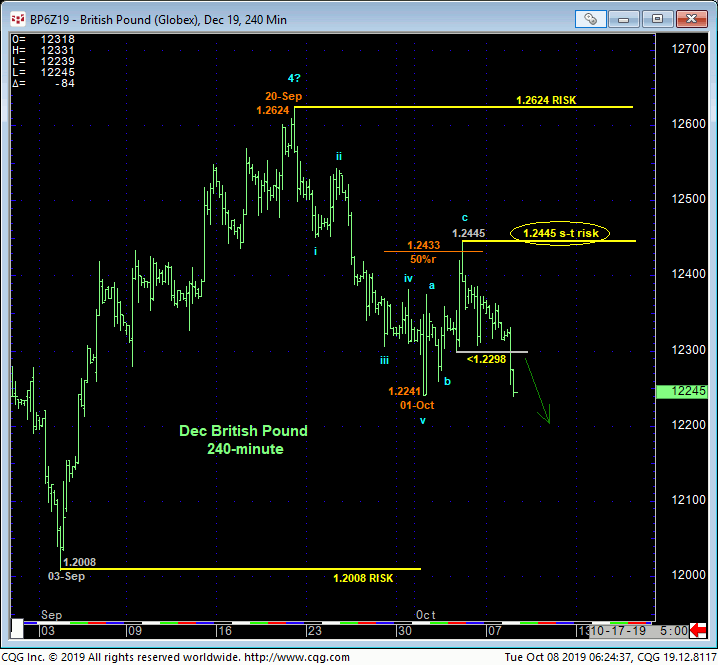
This morning’s failure below Thur’s 1.2298 low and our short-term risk parameter discussed in Thur’s Technical Webcast renders last week’s recovery attempt a 3-wave and thus corrective affair that re-exposes at least late-Sep’s downtrend from 1.2624 that preceded it, and possibly the secular bear trend to new lows below 1.1965. As a direct result of this morning’s weakness, the 240-min chart below shows that the market has identified Thur’s 1.2445 high as the latest smaller-degree corrective high and our new short-term risk parameter from which non-bullish decisions like long-covers and resumed bearish exposure can be objective based and managed by shorter-term traders with tighter risk profiles.
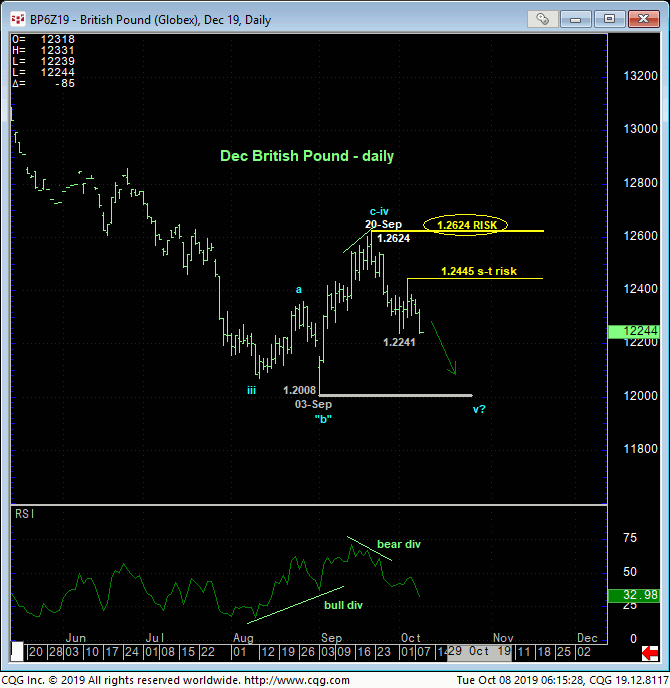
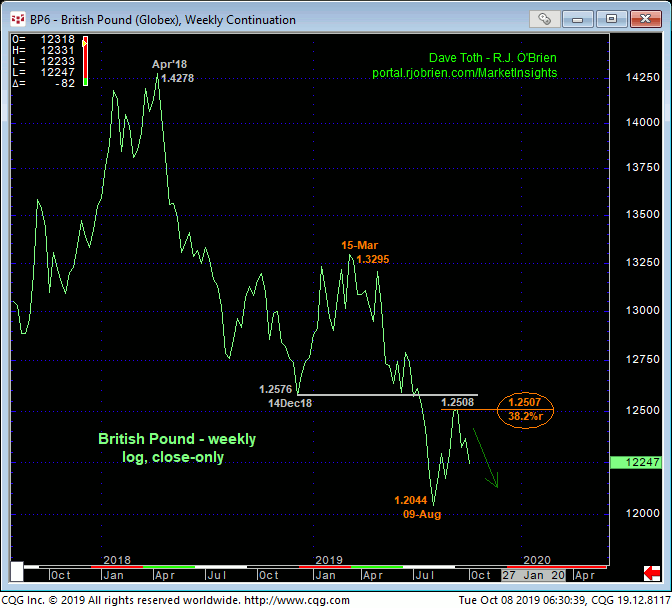
This is relatively nondescript price action from the middle of the past month’s range between 03-Sep’s 1.2008 low in the Dec contract and 20-Sep’s 1.2624 high. But given the exact 38.2% retrace of Mar-Aug’s 1.3295 – 1.2044 decline on a weekly log close-only basis below and the market’s respect for former 1.2576-area support from Dec’18 that, since broken in Jul, now serves as a key new resistance candidate, a resumption of the secular bear market to new lows below Aug’s 1.1965 low in the then-prompt Sep contract should hardly come as a surprise.
On this larger scale, 20-Sep’s 1.2624 intra-day high serves as our key long-term risk parameter from which long-term players can objectively base and manage the risk of a resumed bearish policy.
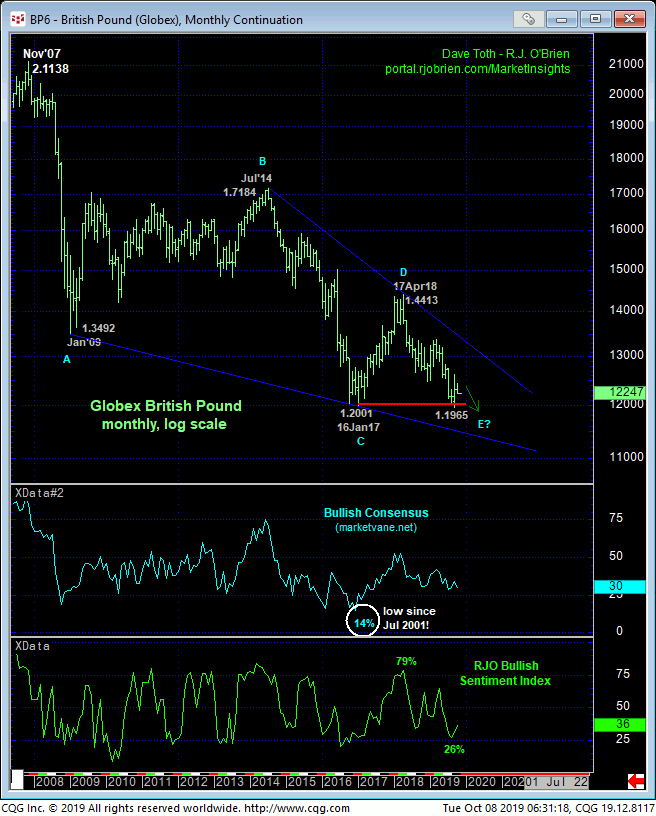
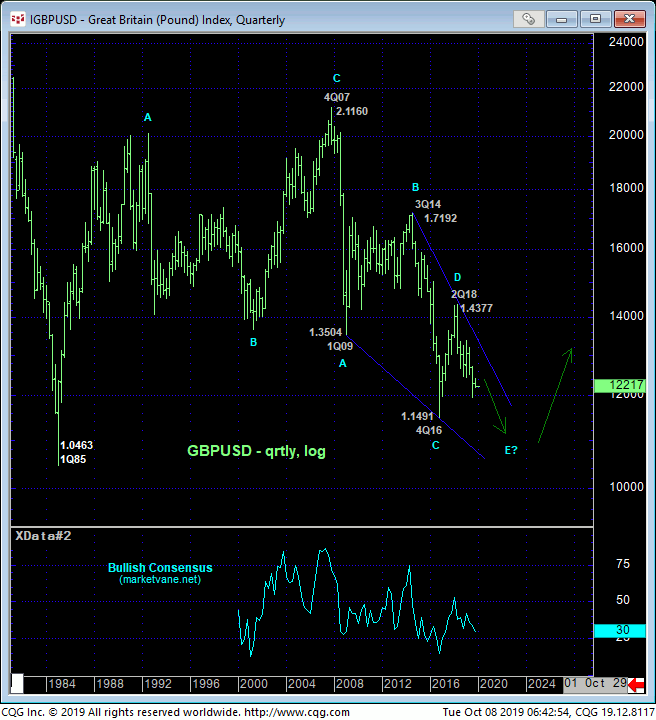
Finally, the monthly log chart of the contract above and quarterly log chart of the cash market below show the secular bear market from Nov 2007s 2.1138 high. We won’t claim any confidence in speculating on a wave count down from that 2007 high, but the least-bearish count would suggest a falling-wedge/diagonal triangle pattern that may only have one more round of new lows below 2016’s lows to go. How MUCH below those lows is wide open, including a run at 1985’s 1.05-area lows. We can only address such downside potential as it unfolds with, as always, a confirmed bullish divergence in momentum of a larger scale required to even defer the bear, let alone threaten it.
These issues considered, a resumed bearish policy and exposure are advised for both short- and longer-term players from current 1.2250-area levels with a recovery above 1.2445 required to negate this specific call for shorter-term traders and warrant its cover. Commensurately larger-degree strength above 1.2624 is required to negate this count for long-term players and warrant neutralize expose ahead of a base/reversal count that could be major in scope. In lieu of strength above at least 1.2445 and preferably 1.2624, a resumption of the secular bear trend to eventual new 2019 lows is expected.
