SEP BRITISH POUND
Just a week-and-a-half after breaking to a new low for the year and arguably breaking the secular bull trend from Mar’20’s 1.1438 low, the market’s gross failure to sustain those losses and subsequent bullish divergence in daily momentum above 12-Jul’s 1.3913 corrective high not only breaks the downtrend from 01-Jun’s 1.4256 high, but possibly renders this year’s entire sell-off attempt from 24-Feb’s 1.4245 high a 3-wave and thus corrective structure that could re-expose the secular bull to eventual new highs above 1.4256. This downtrend-stemming bullish divergence in momentum is shown in the daily chart below and defines 20-Jul’s 1.3573 low as THE END of the decline from 01-Jun’s 1.4256 high. Per such, this 1.3573 level serves as our new long-term risk parameter from which non-bearish decisions like short-covers and new bullish punts can be objectively based and managed by longer-term institutional players.
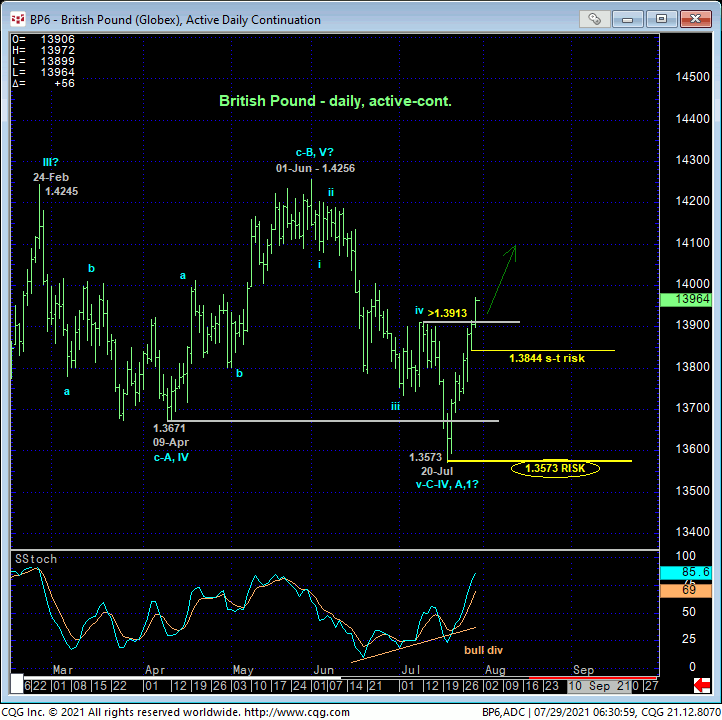
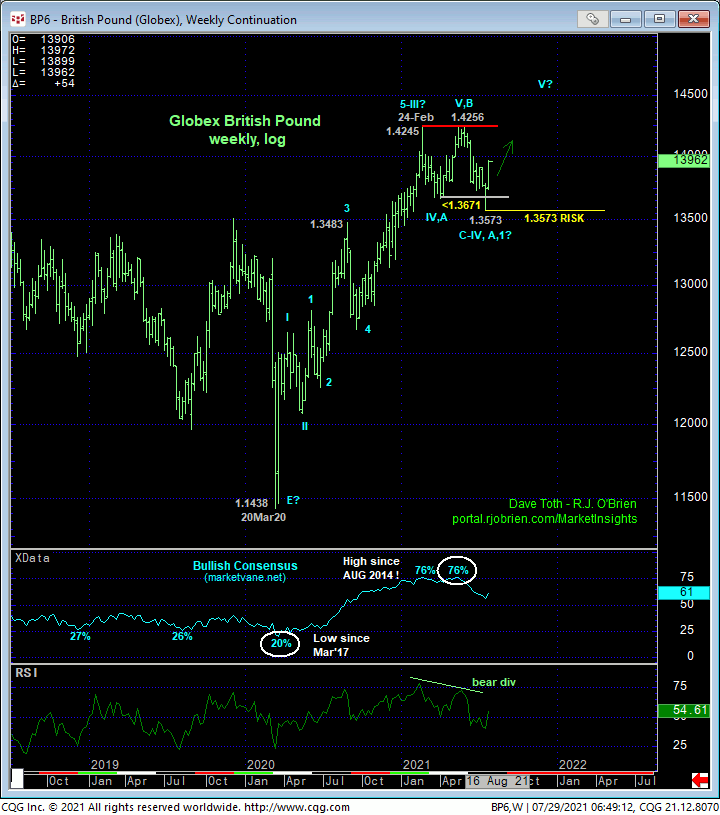
As a result of today’s bullish divergence in momentum, and especially on a longer-term weekly basis below, it’s not hard to see the resumed bullish prospects on a major scale as this entire year’s sell-off attempt looks about as corrective and bull-flagish as it gets; so if this count is correct and if last week’s 1.3573 low ENDED the correction, traders should expect and require sustained, trendy, impulsive behavior to the upside straight away. We pose this requirement due to an alternate bearish count that suggests Jun-Jul’s decline from 1.4256 to 1.3573 is just the initial (A- or 1st-Wave) of a larger-degree peak/correction/reversal process. And if this alternate count is what the market has in mind, then a bearish divergence in momentum somewhere between spot and Jun’s 1.4256 would be required to arrest this clear and present and developing uptrend. Until and unless such a momentum failure is confirmed, further and possibly accelerated gains straight away should not surprise.
This said, the fact that this market has thus far only returned to the middle of this year’s range serves as a warning for aimless whipsaw risk typical of such range-center environs.
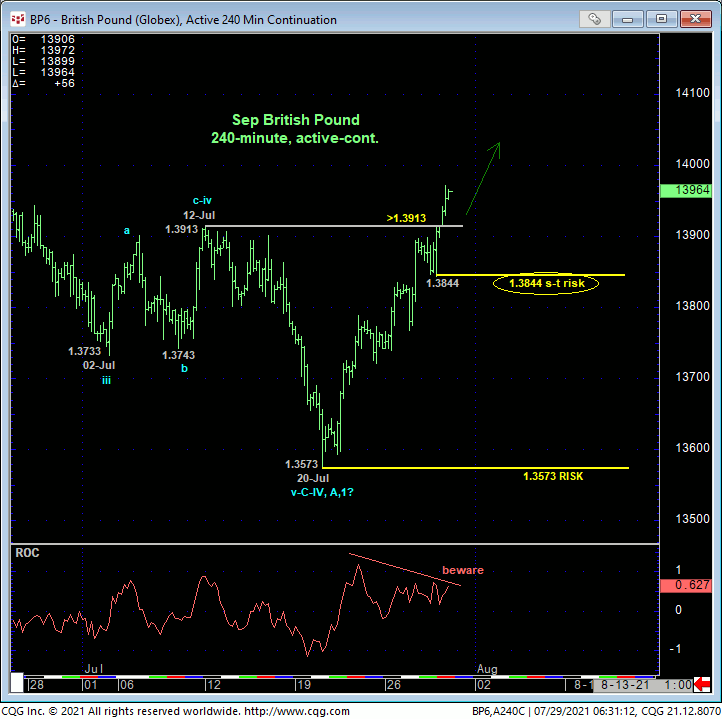
From a short-term perspective, the 240-min chart below shows overnight’s clear break above 12-Jul’s 1.3913 corrective high that breaks Jun-Jul’s downtrend and leaves smaller- and larger-degree corrective lows in its wake at 1.3844 and 1.3573. A failure below 1.3844 will confirm a bearish divergence in momentum, so this level now serves as our new short-term risk parameter from which shorter-term traders with tighter risk profiles can objectively base non-bearish decisions like short-covers and cautious bullish punts. This tight but objective risk parameter may come in handy given the market’s aforementioned position in the middle of this year’s range where the odds of aimless whipsaw risk are approached as higher.
These issues considered, all previously recommended bearish policy and exposure have been nullified by overnight’s recovery above 1.3913. Traders are further advised to first approach setback attempts to 1.3900 OB as corrective buying opportunities with a failure below 1.3844 required to neutralize exposure ahead of a preferred risk/reward buying condition on a steeper corrective setback. In lieu of such sub-1.3844 weakness, further and possibly accelerated gains straight away are expected.
SEP CANADIAN DOLLAR
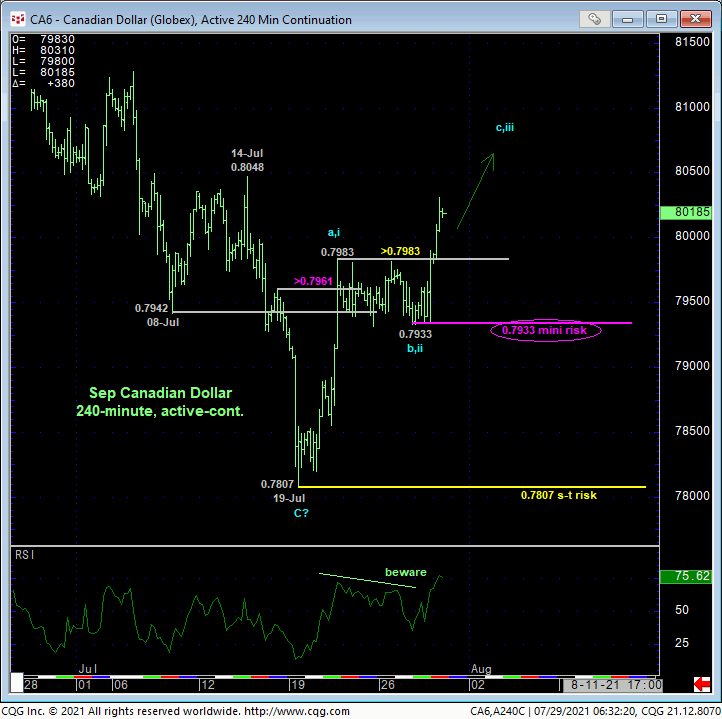
We touched on an alternate bullish count in Tue’s Technical Webcast, and overnight’s resumption of last week’s recovery above last week’s 0.7983 initial counter-trend high reinforces this bullish call by confirming a bullish divergence in momentum. This momentum failure leaves Tue’s 0.7933 low in its wake as a smaller-degree corrective low and new mini risk parameter from which non-bearish decisions like short-covers and cautious bullish punts can be objectively based and managed. The increasing importance of 19-Jul’s 0.7807 low goes without saying.
Former 0.7980-area resistance is considered new near-term support.
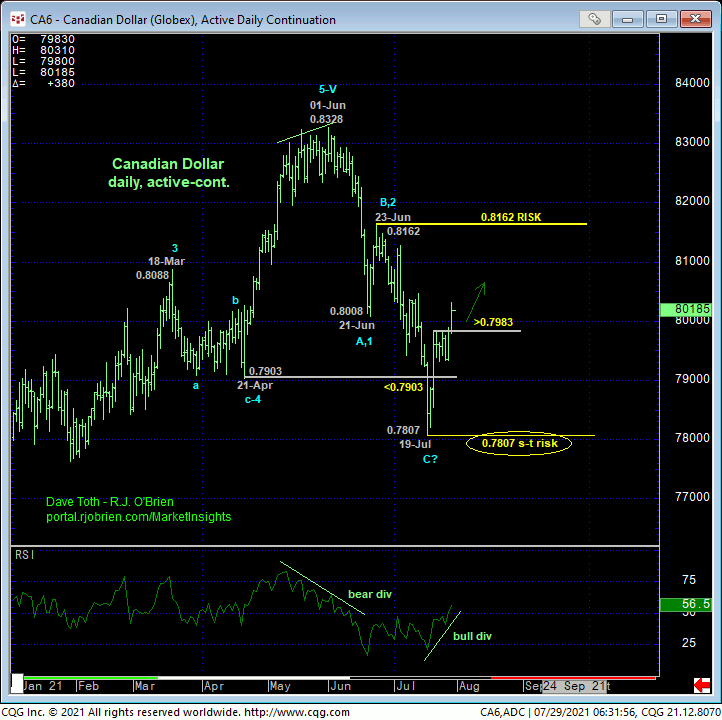
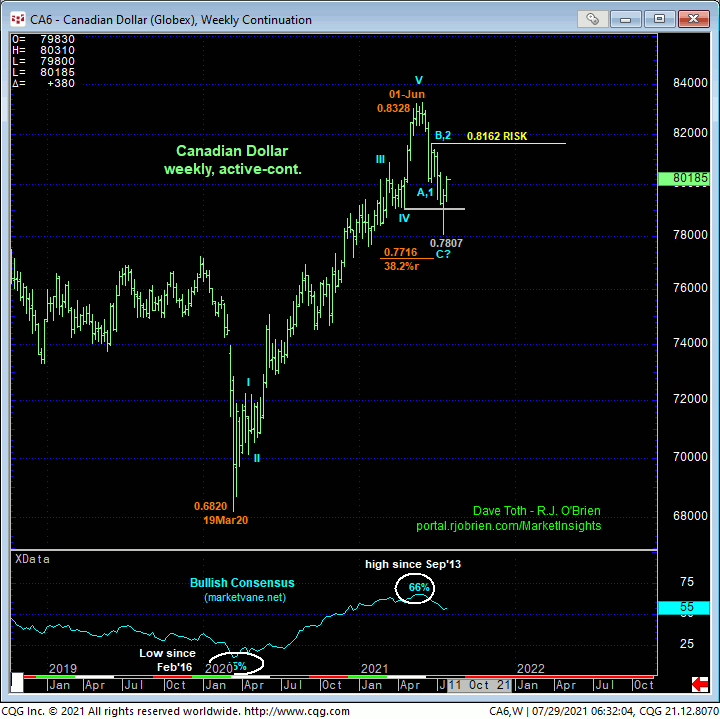
The daily bar chart above shows the bullish divergence in momentum above 21-Jul’s 0.7983 initial counter-trend high, marking 19-Jul’s 0.7807 low as the obvious level and risk parameter this market now needs to relapse below to mitigate a base/reversal count and reinstate the bear. The fact that this non-weakness came within a couple days of this market’s failure below 21-Apr’s pivotal 0.7903 low that, in fact, broke the 15-MONTH uptrend is telling. Combined with what is arguably a textbook 3-wave and thus corrective sell-off attempt from 02-Jun’s 0.8308 high on a daily close-only basis below where the prospective C-Wave from 25-Jun’s 0.8129 high is identical to Jun’s initial (A-Wave) decline from 0.8308 to 0.8024 (i.e. 1.000 progression), we cannot ignore the very bullish prospect that last week’s 0.7807 intra-day low COMPLETED a correction from the Jun high and that the secular bull trend is poised to resume to eventual new highs above 0.8328. A recovery above 23-Jun’s 0.8162 larger-degree corrective high remains required however to confirm Jun-Jul’s sell-off as a 3-wave and thus corrective affair.
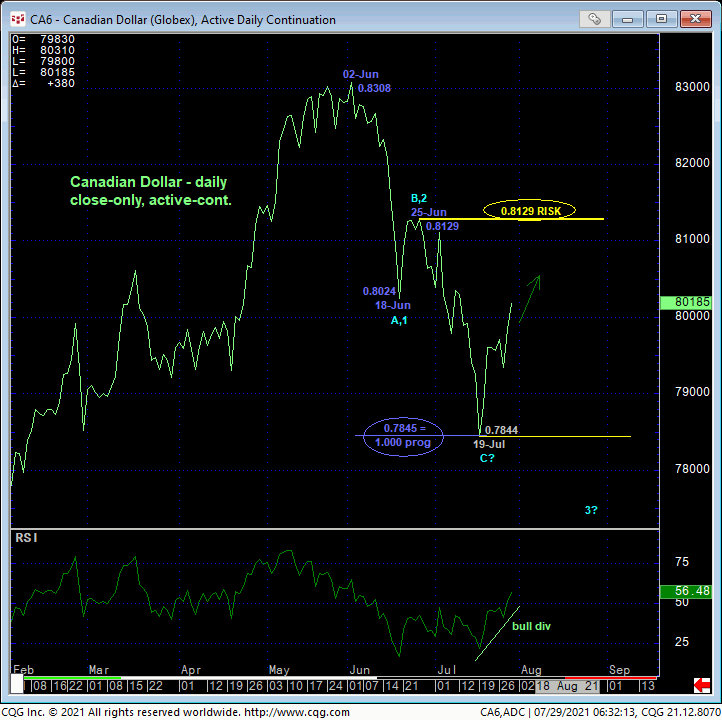
The weekly chart below shows last week’s break of the secular bull trend below 21-Apr’s 0.7903 larger-degree corrective low and pivotal risk parameter, giving the bear every opportunity in the world to perform. Thus far, this performance is miserable and, for the reasons specified above, flips the script back to the bull side and a potential resumption of the secular bull trend to eventual new highs above 0.8328. But if this is what the market has in mind, then it’s imperative that the bull BEHAVES LIKE ONE by sustaining trendy, impulsive price action to the upside. This means sustaining gains above levels like 0.7933 and especially 0.7807 and recouping 23-Jun’s 0.8162 high.
These issues considered, traders are advised to neutralize all previously recommended bearish exposure if they haven’t done so already. Furthermore, setback attempts to 0.8000 OB are advised to first be approached as corrective buying opportunities with a failure below 0.7933 required to defer or threaten this call enough to warrant moving to the sidelines to keep powder dry for a preferred risk/reward buying opportunity following a steeper but corrective rebuttal to this second-half of Jul’s recovery. In lieu of such sub-0.7933 weakness, further and possibly accelerated gains straight away should not surprise.
