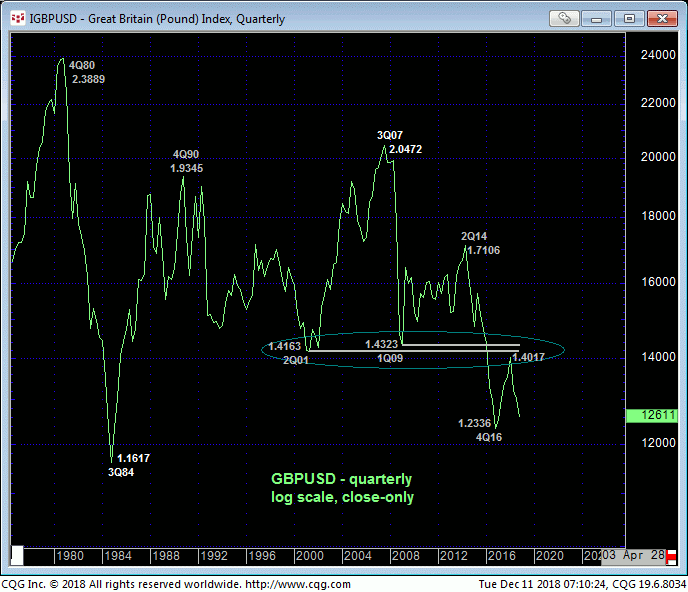
Yesterday’s decisive break below the past FOUR MONTHS of support from the upper-1.26-handle-area confirms our resumed bearish count reintroduced in 09-Nov’s Technical Blog and leaves Thur’s 1.2817 high in its wake as the latest smaller-degree corrective high this market is now minimally required to recoup to even defer, let alone threaten this continued bearish count. In this regard this 1.2817 level is considered our new short-term risk parameter from which shorter-term traders can objectively rebase and manage the risk of still-advised bearish exposure.
Former 1.2675-to-1.2725-area support is considered new and key near-term resistance.
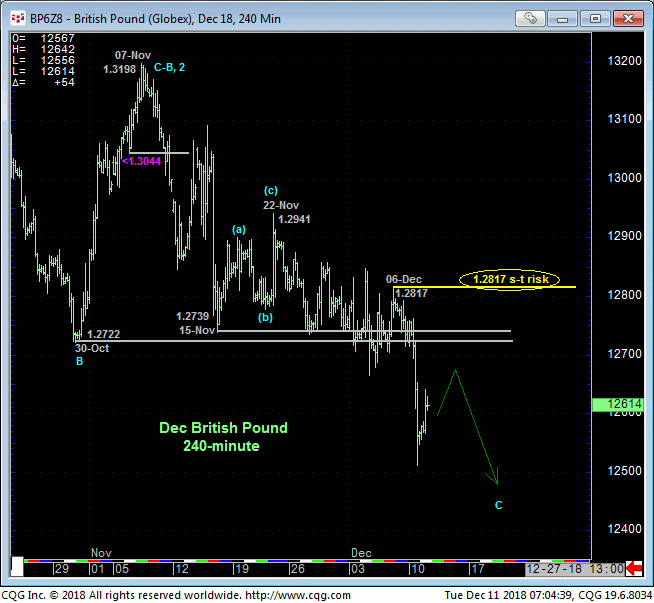
The daily chart above shows the the pertinence of yesterday’s breakdown to new lows for 2018’s downtrend. The 1.2675-to-1.2725-area is a very obvious and now former support area that is fully expected to hold as new resistance if the market has broader bearish intentions still.
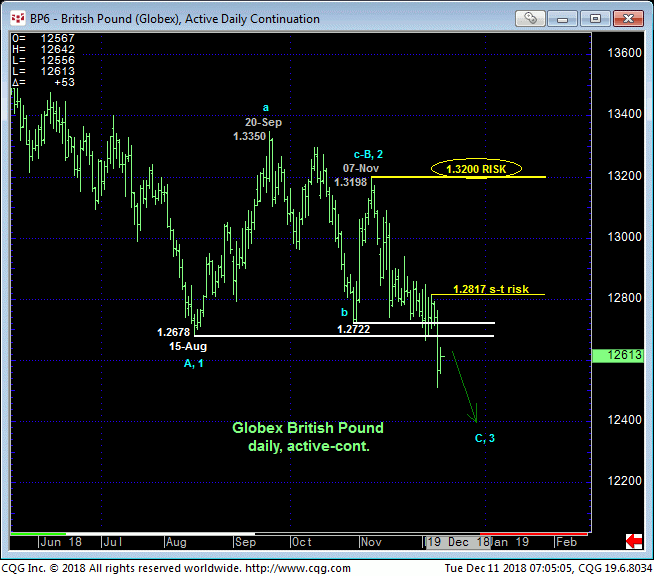
From a broader perspective, the weekly log chart below shows yesterday’s break below 1.2678 exposing an area totally devoid of any technical levels of merit shy of Jan’17’s 1.2001 low. This doesn’t mean we’re forecasting a move to 1.2001, but it certainly does mean that until and unless this market recoups at least 1.2817, the market’s downside potential is indeterminable and potentially severe, including a run at 1.2000.
Contributing to this downside vulnerability is the past couple months’ RISE in our RJO Bullish Sentiment Index of the hot Managed Money positions reportable to the CFTC DESPITE falling prices. The Managed Money community’s attempt to fade the downtrend and catch the proverbial falling knife can be an accelerant to the bear as the overall market forces the capitulation of this long-&-wrong exposure.
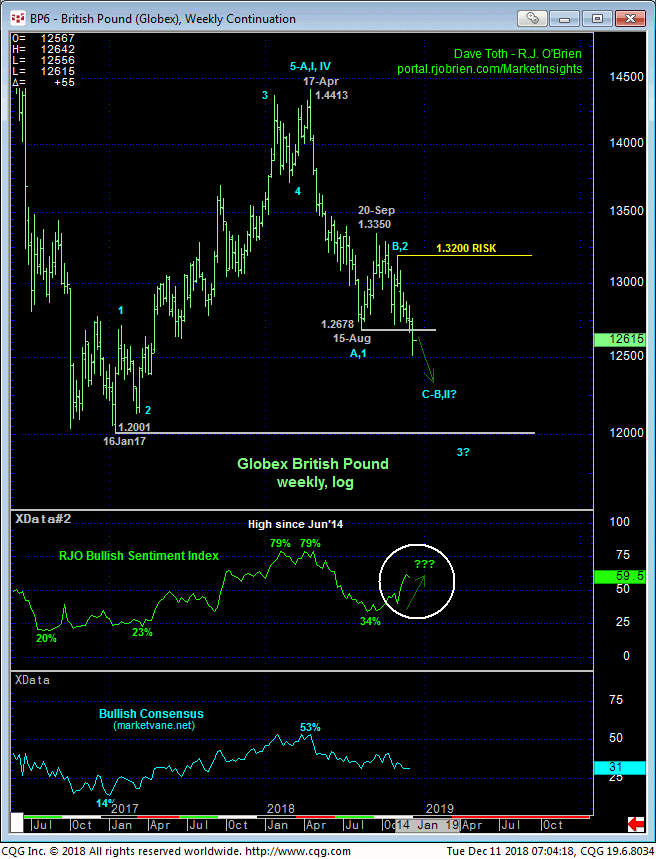
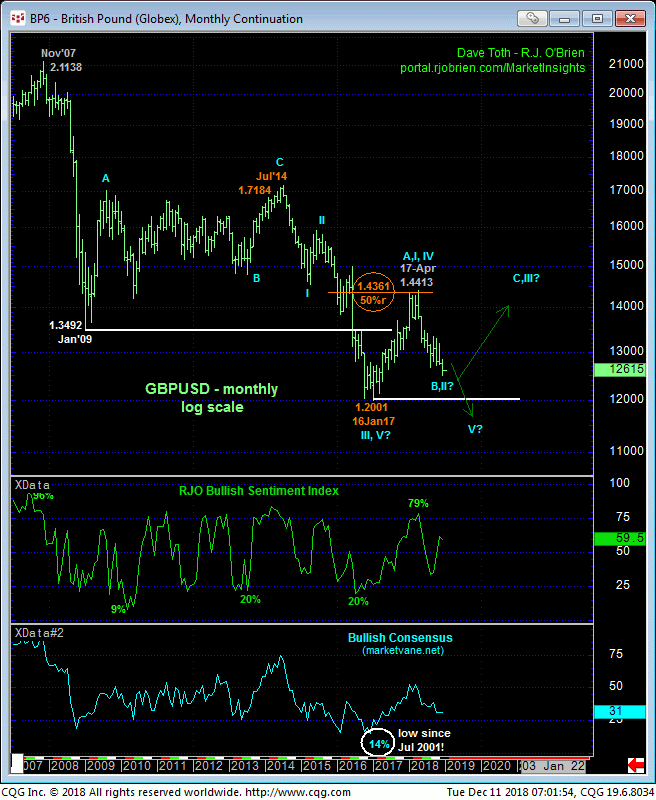
Finally and as we’ve been discussing all year, the very long-term directional debate centers around what the Jan’17 – Apr’18 recovery attempt is. Is it the start of a major base/reversal process or another correction within the secular bear trend to new lows below 1.2000? The fact that this recovery stalled just a half-figure away from the (1.4361) 50% retrace of 2014 – 2017’s 1.7184 – 1.2001 decline would seem to reinforce the latter, bearish count. And looking at an even longer-term quarterly log close-only chart below that clears out a lot of intra-quarter pricing “noise”, 2017-18’s recovery attempt failed to recoup a massive 20-yr barrier of former support around 1.41 that, since broken in early-2016, maintains its stature as a massive resistance area.
These issues considered, a bearish policy and exposure remain advised with strength above at least 1.2817 now required for shorter-term traders to move to the sidelines and long-term players to pare bearish exposure to more conservative levels. In lieu of such strength we anticipate further and possibly accelerated losses that could even resurrect the secular bear trend below 1.2001.
