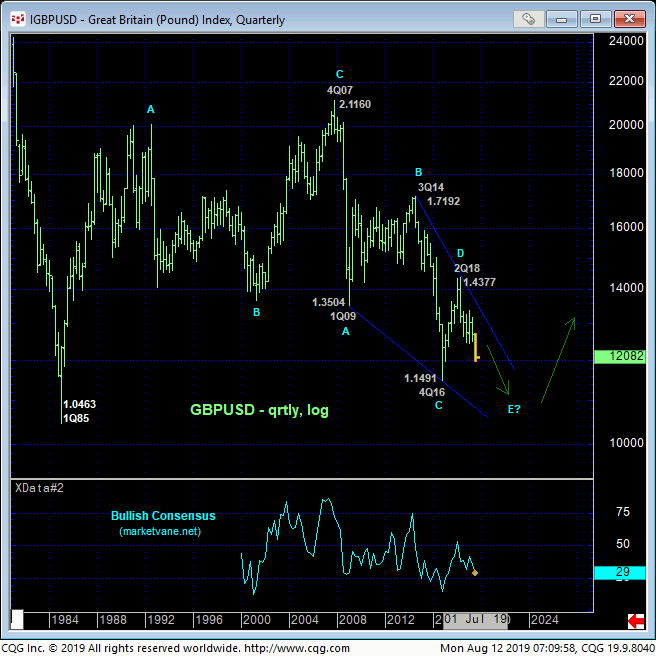
Fri’s break to yet another round of new lows, this time below 01-Aug’s 1.21904 low, reaffirms the major bear trend and leaves 06-Aug’s 1.2232 high in its wake as the latest smaller-degree corrective high this market is now minimally required to recoup to even defer, let alone threaten the bear. Per such this 1.2232 level becomes our new short-term risk parameter from which shorter-term traders with tighter risk profiles can objectively rebase and manage the risk of a still-advised bearish policy. Former lower-1.21-handle-area support is considered new near-term resistance.
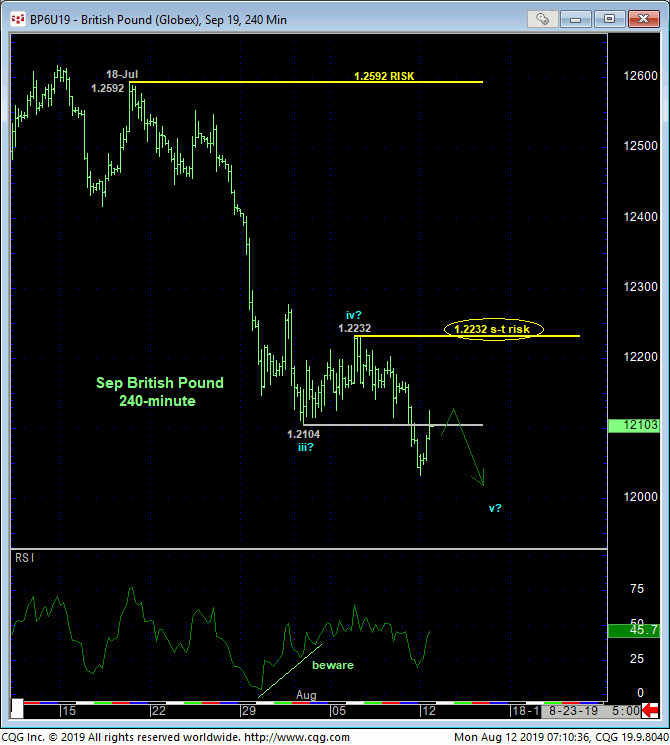
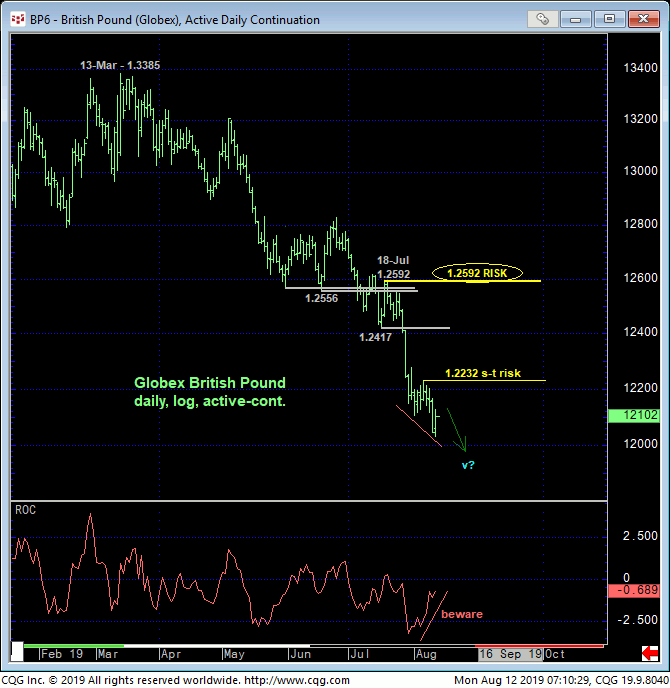
The dominance of the major bear trend is clear in the daily (above) and weekly (below) log scale charts. On this scale, commensurately larger-degree strength above 18-Jul’s 1.2592 next larger-degree corrective high and long-term risk parameter remains minimally required to threaten the major bear trend and long-term bearish policy. Key former 1.2500-area support is an obvious new resistance candidate the bull would have to hurdle to merit and consideration.
Understandably, market sentiment/contrary opinion indicators have been and remain at historically bearish levels typical of major BASE/reversal environments, but traders are reminded that sentiment is not an applicable technical tool in the absence of an accompanying confirmed bullish divergence in momentum needed to, in fact, stem the clear and present downtrend. Herein lies the importance of that larger-degree corrective high and key risk parameter at 1.2592.
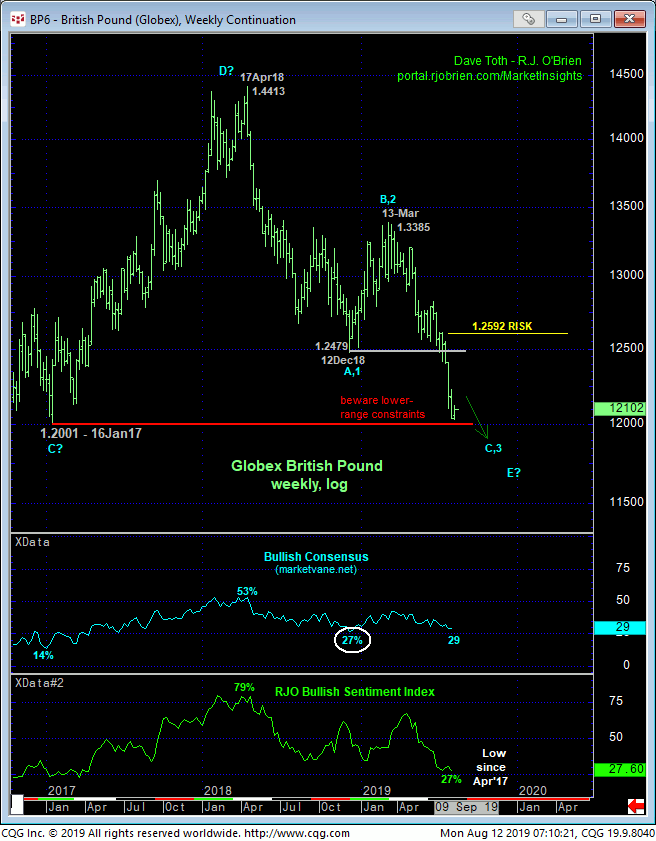
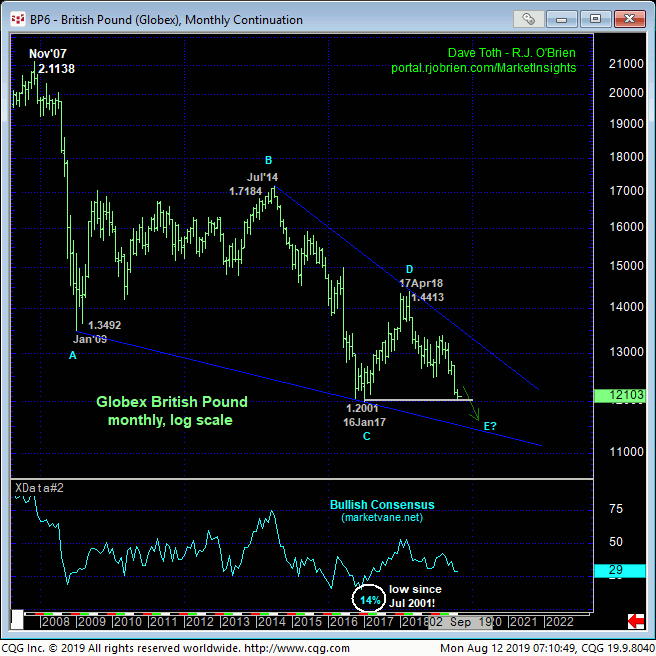
Finally and from a very long-term historical perspective shown in the monthly log chart of the contract above and the quarterly log chart of the cash market below, we believe the extent of the past year’s relapse renders Jan’17 – Apr’18’s recovery attempt a corrective structure within a massive falling-wedge (5th-wave diagonal triangle) pattern down from 4Q07’s highs that would be expected to break 2016’s lows.
The contract low for that period was 16Jan17’s 1.2001 low. The underlying cash market’s low was 1.1491. We believe this warns of indeterminable and potentially sharp losses in the contract below 1.2000 and very possibly below 1.1491 in the cash. In both the hyperbole 2016 and 1985 lows and ENDS of major bear trends however, the market produced very high-profile lows and reversals. In the months and perhaps even quarters ahead, we should not be surprised at all with the same type of base/reversal environment. For the time being however and foreseeable future, we believe this market remains vulnerable to further and possibly accelerated, “headline-emotional” losses to levels indeterminably lower warranting a continued bearish policy and exposure. Shorter-term traders are advised to neutralize exposure on a recovery above 1.2232 while longer-term players are advised to maintain exposure until negated by a recovery above 1.2592.
