SEP BRITISH POUND
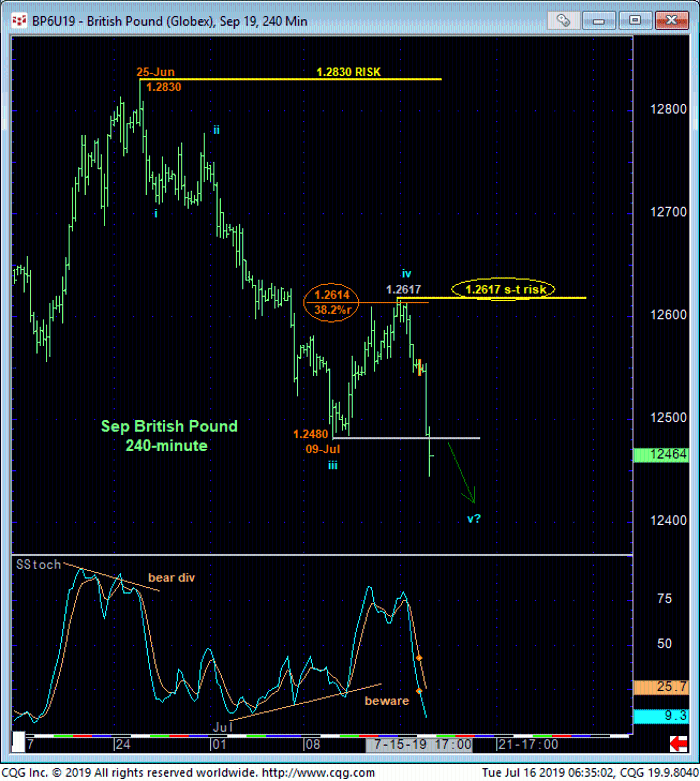
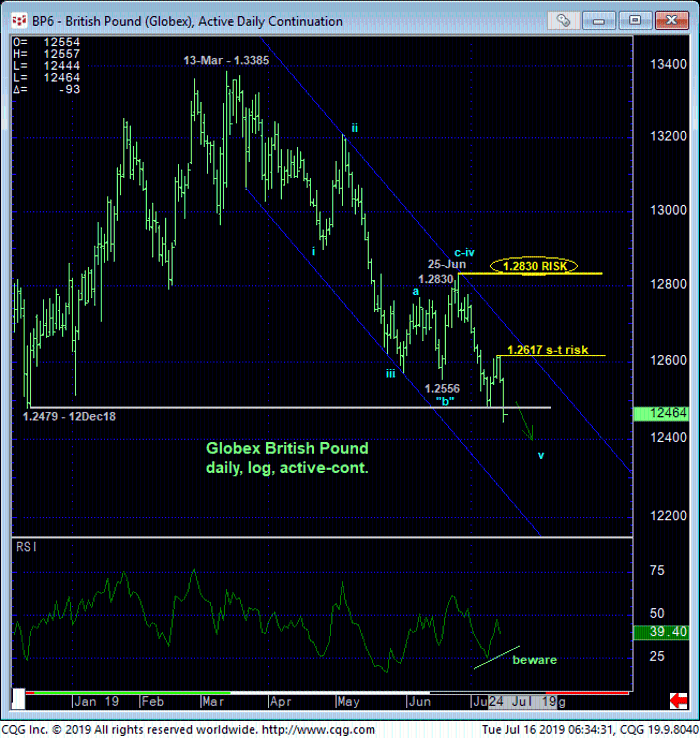
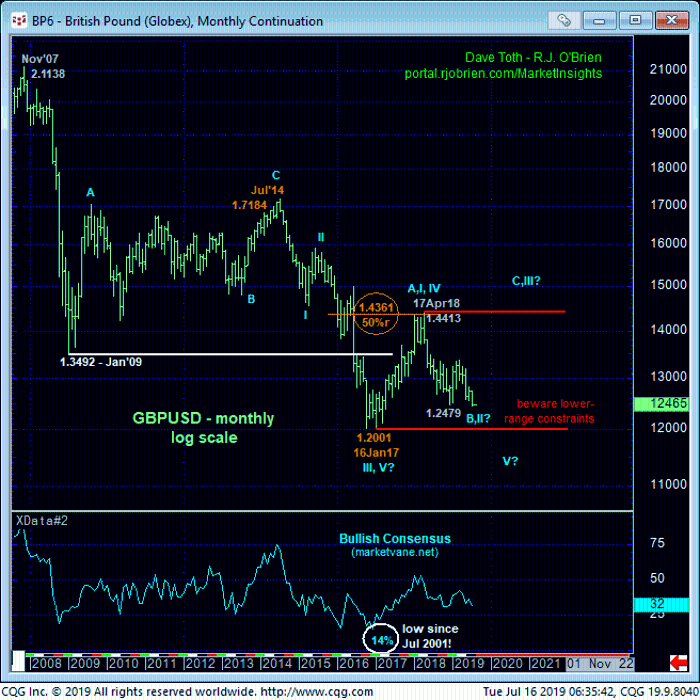
Today’s clear, impulsive break below not only 09-Jul’s 1.2480 low but also 12Dec18’s 1.2479 low reinstates the major bear trend that dates from Apr’18’s 1.4413 high. This continued weakness leaves Fri’s 1.2617 high and 38.2% retrace of Jun-Jul’s 1.2830 – 1.2480 break in its wake as the latest smaller-degree corrective high this market is now minimally required to recoup to even defer, let alone threaten the bear. Per such this 1.2617 high is considered our new short-term risk parameter from which a still-advised bearish policy can be objectively rebased and managed by shorter-term traders with tighter risk profiles.
Commensurately larger-degree strength above 25-Jun’s 1.2830 larger-degree corrective high and key long-term risk parameter remains required to conclude the end of what would be a complete 5-wave downtrend from 13-Mar’s 1.3385 high and expose a base/reversal count that could be major in scope. In lieu of at least such 1.2617+ strength, the trend is down on all practical scales and should not surprise by its continuance or acceleration.
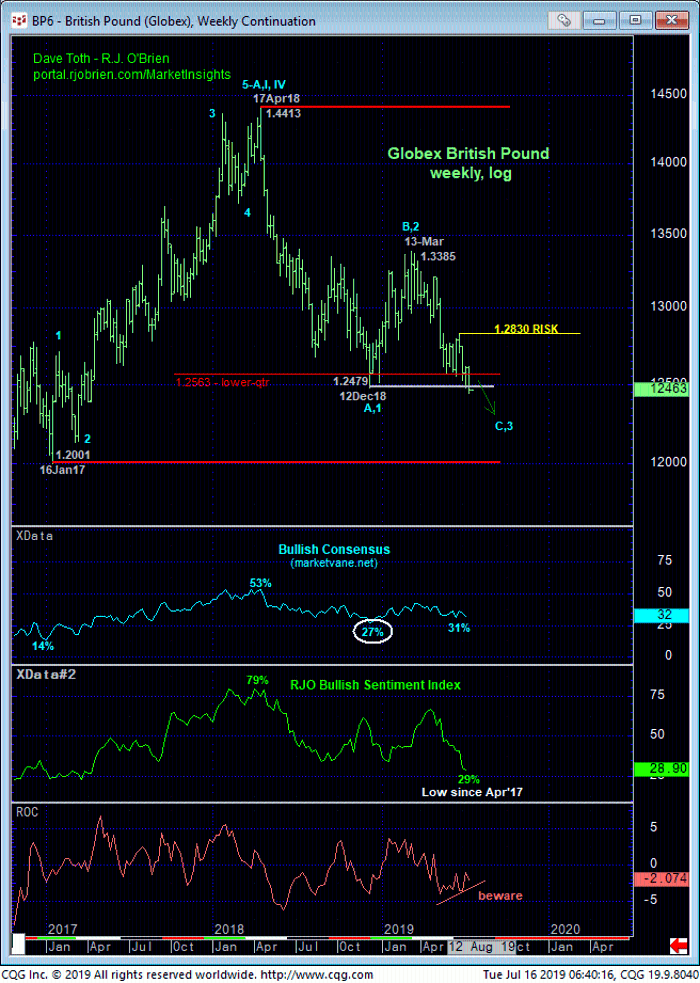
These risk parameters may come in handy given the market’s engagement of the lower-quarter of the past 2-1/2-YEAR range amidst historically bearish levels of market sentiment typical of major BASE/reversal environments. But traders are reminded that sentiment/contrary opinion is not an applicable technical tool in the absence of an accompanying confirmed bullish divergence in momentum of a scale sufficient to break the broader downtrend. Herein lies the importance of recent corrective highs and risk parameters at 1.2617 and especially 1.2830, the recoveries above which are required to defer or threaten the major downtrend.
With respect to this market’s downside potential, it is wide open; anything from a few more pips to an assault on Jan’17’s 1.2001 low as today’s break below Dec’18’s 1.2479 low has exposed an area totally devoid of any technical levels of merit shy of 1.2001. The ONLY levels of any technical merit now exist only above the market in the forms of former support-turned-resistance like the 1.2480-area and prior corrective highs like 1.2617 and 1.2830. The only levels that exist between 1.2480 and 1.2001 are “derived” technical levels like various “bands”, imokus, channel lines and even vaunted Fibonacci progression levels that have NEVER proven to provide reliable reasons to buck a trend without an accompanying bullish (in this case) divergence in momentum needed to, in fact, break that trend. And such momentum divergence require a recovery above a prior corrective high like 1.2617 to be considered CONFIRMED to the point of non-bearish action.
In sum, the trend is down on all scales with indeterminable downside potential that warrants a full bearish policy. Strength above 1.2617 is minimally required to threaten this call and warrant defensive measures. In lieu of such strength further and possibly accelerated losses should not surprise.
SEP EURO
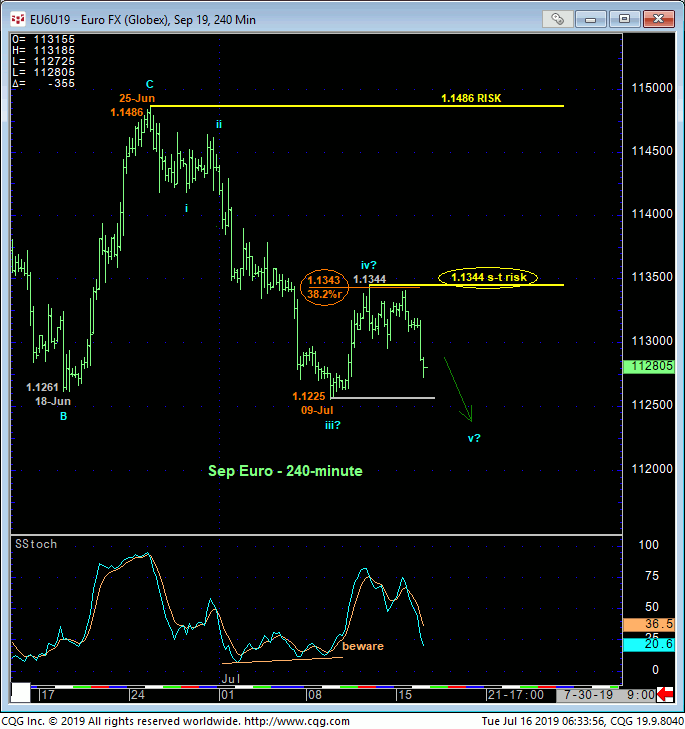
Like sterling, the 240-min chart of the Euro shows that last week’s recovery attempt also stalled at the exact (1.1343) 38.2% retrace of late-Jun/early-Jul’s 1.1486 – 1.1225 decline that would seem to reinforce a count calling this recovery attempt a mere correction within a larger-degree move south. Furthermore, because of sterling’s performance and because of the broader downtrend’s backdrop, we believe today’s relapse provides sufficient evidence to conclude Thur’s 1.1344 high as the end or upper boundary of a correction even though the market has yet to take out 09-Jul’s 1.1225 low needed to confirm it as such.
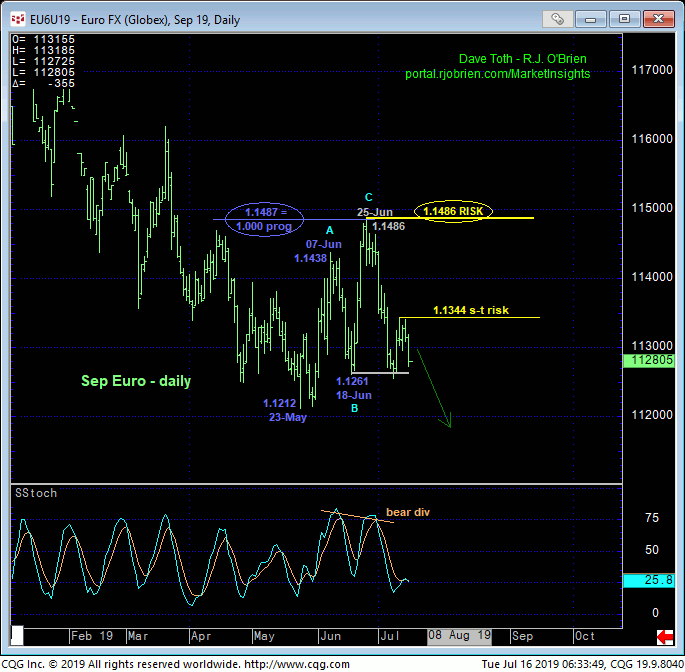
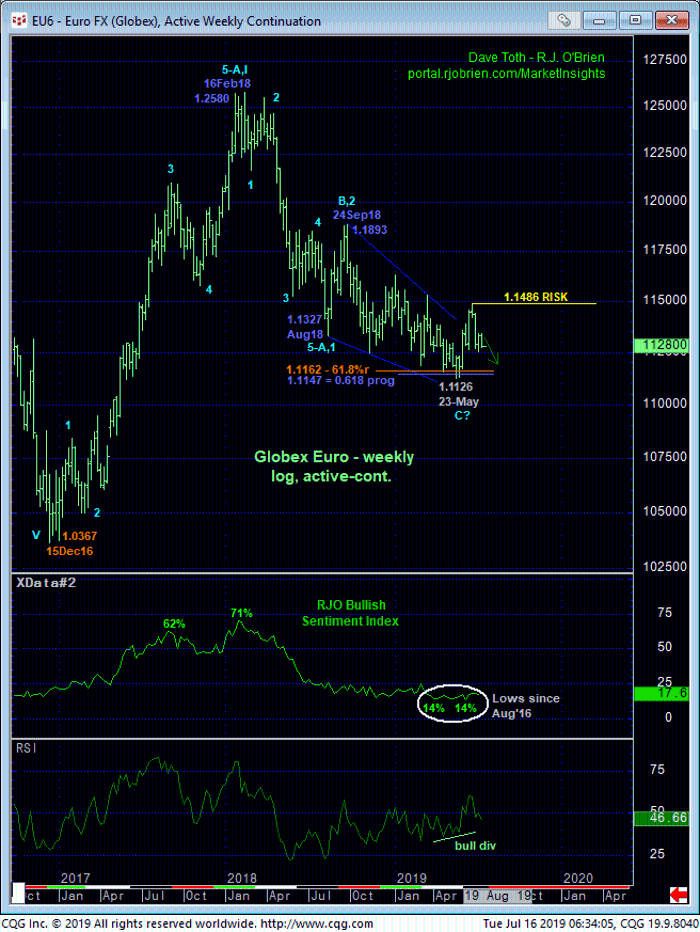
Taking a step back and as discussed in recent updates, this month’s relapse and last week’s suspected corrective recovery attempt comes on the heels of May-Jun’s textbook 3-wave corrective recovery attempt from 1.1212 to 1.1486 as labeled in the daily chart above. Against the backdrop of the major downtrend from Feb’18’s 1.2580 high shown in the weekly log chart below, it’s hard not to expect a resumption of this 17-month bear trend to new lows below May’s 1.1126 low.
In the past couple months’ updates we have alluded to a major BASE/reversal-threat environment for long-term momentum, sentiment, Elliott and Fibonacci reasons. But as a result of the extent of late-Jun/early-Jul’s relapse that renders May-Jun’s recovery as a corrective structure, a resumption of the major downtrend to at least one more round of new lows should not now come as a surprise. And once below May’s 1.1126 low, the market’s downside potential thereafter would have to be approached as indeterminable and potentially severe.
These issues considered, a bearish policy remains advised with minimum strength above 1.1344 required to pare or neutralize bearish exposure. In lieu of such strength, further and possibly accelerated losses are expected.
