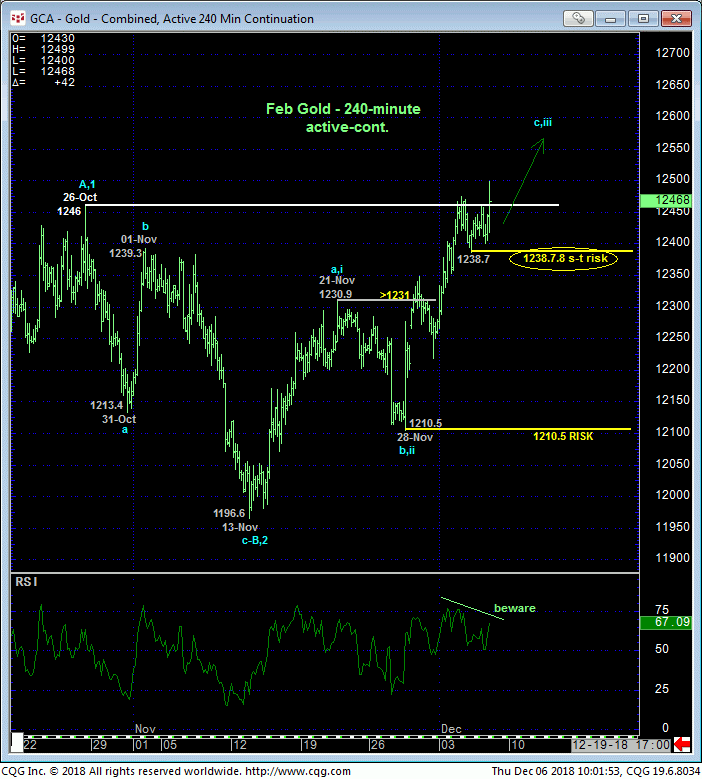
Today’s clearer breakout above the 1246-area that has capped this market as resistance since late-Oct reaffirms our longer-term bullish count and leaves smaller- and larger-degree corrective lows in its wake at 1238.7 and 1210.5, respectively, that the market is now required to fail below to defer or threaten a more immediate bullish count. Per such these levels represent our new short- and longer-term risk parameters from which a bullish policy and exposure can be objectively rebased and managed.


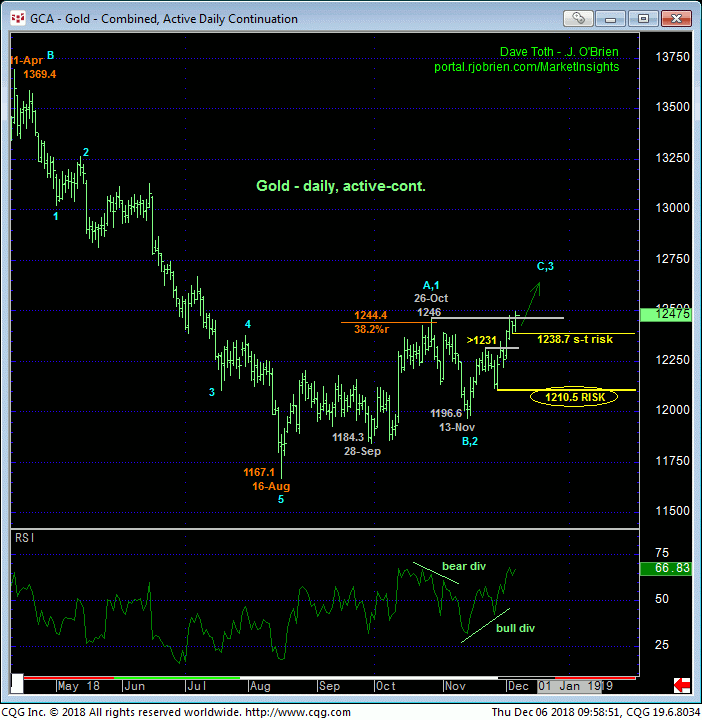
The daily chart above better shows the gravity of this week’s and today’s break above 26-Oct’s 1246 high as it resurrects a developing uptrend that can look back on FOUR MONTHS of basing behavior. This resumed strength reinforces our bullish count introduced in 11-Oct’s Technical Blog stemming from the unique combination of:
- a confirmed bullish divergence in momentum from
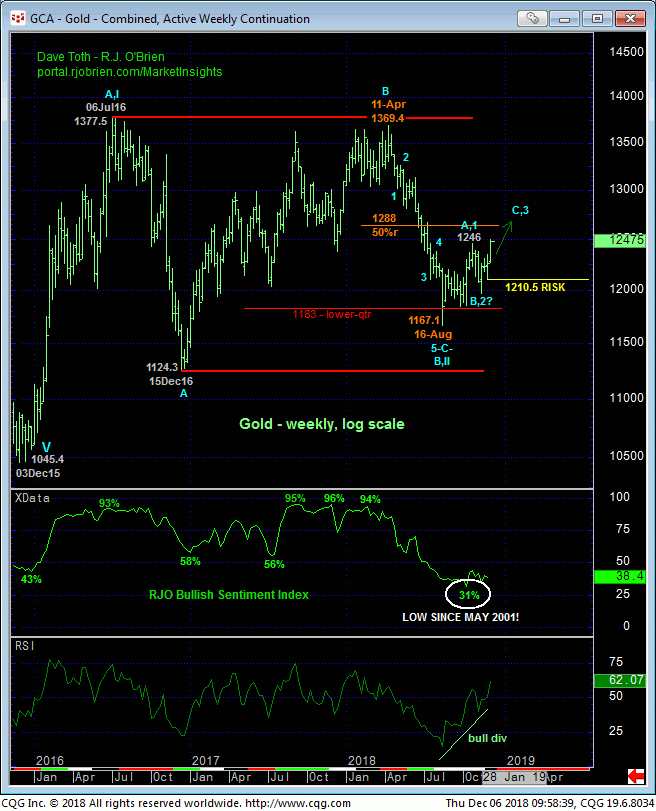
- the lower-quarter of the past couple years’ range amidst
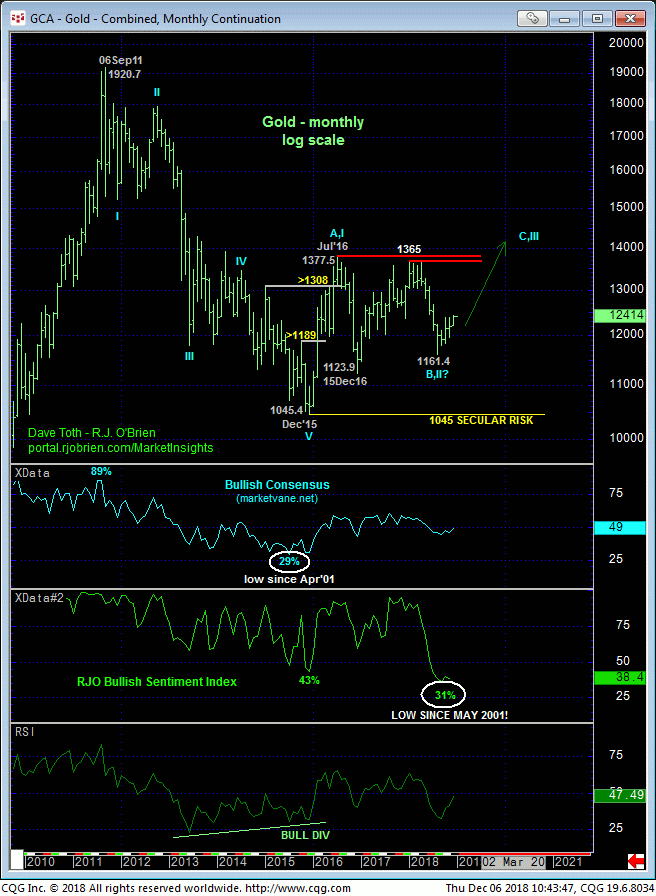
- historically bearish sentiment levels not seen since 2001 and
- an arguably complete 5-wave Elliott sequence down from 11-Apr’s 1369.4 high.
On this broader scale a failure below 28-Nov’s 1210.5 low is now required to diffuse this bullish count, resurrect an alternate bearish count that contends the recovery from 16-Aug’s 1167 low is a 3-wave and thus corrective affair, and re-expose this year’s downtrend. Until and unless such sub-1210.5 weakness is shown, the long-term trend is, in fact, up.

From an even longer-term perspective, traders are reminded of a really bullish environment that contends that the price action down from Jul’16’s 1377 high is merely a (B- or 2nd-wave) correction within a multi-year BASE/reversal process that projects to eventual new highs above 1377. Is the past four months’ grinding price action the BASE for such a launch?
The better question is: Do you want to bet that the past four months’ price action ISN’T the base for such a launch? We wouldn’t, especially given the market’s definition of an outstanding and objective level at 1210.5 from which to position for ANY amount of upside.
These issues considered, an aggressive bullish policy and exposure is advised with a failure below 1238.7 for shorter-term traders to step aside and commensurately larger-degree weakness below 1210.5 for longer-term players to step aside. In lieu of such weakness we anticipate further and possibly explosive gains straight away.


