In the early morning trade, August gold has continued yesterday’s sell off, which is largely due to strength in the US dollar and favorable US economic data from initial jobless claims. Also, former FBI director Comey’s testimony on the Trump Russian saga ended up being uneventful and probably took the fear trade off the table for the bulls. Furthermore, the UK political uncertainty failed to bring fear buying into the market.
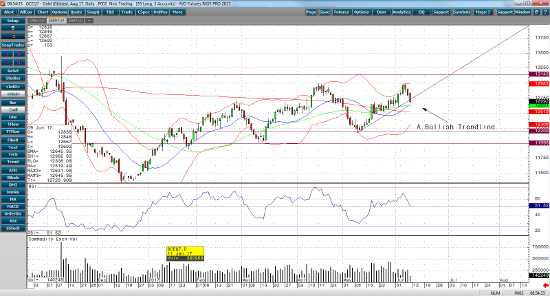
If we take a look at the daily August gold chart, you’ll see that it’s pulled back just $30 of its June 6 high of $1,298.8. Its also breached a one month bullish trend line, but currently has not closed below it and is still trading above all its major moving average with the 20-day trying to cross above the 50-day, which usually means to bullish trend will continue, but only time will tell. Below is a chart of the daily August gold chart.
Aug ’17 Gold Daily Chart


