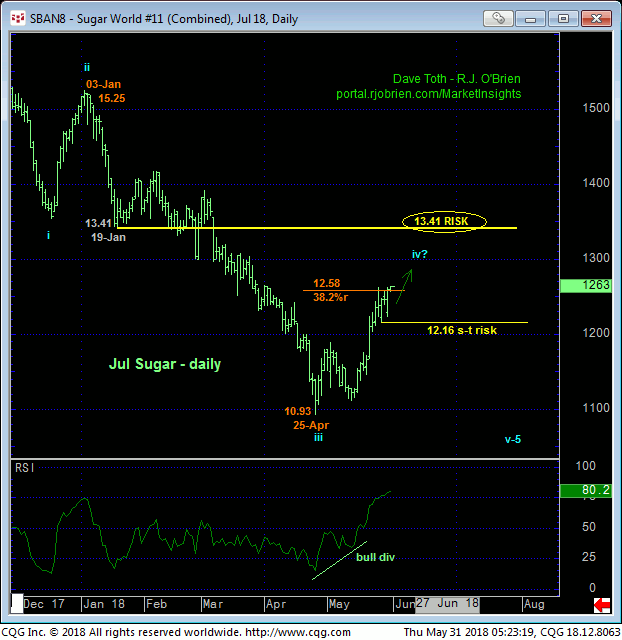
Yesterday and today’s resumed gains above last week’s 12.62 high reaffirms the developing intermediate-term uptrend and leaves 25-May’s 12.16 low in its wake as the latest smaller-degree corrective low the market is now minimally required to fail below to confirm a bearish divergence in momentum, stem the rally from at least 11-May’s 11.12 low and expose a larger-degree correction lower or possibly a resumption of the secular bear trend. In this regard, 12.16 is considered our new short-term risk parameter from which non-bearish decisions like short-covers and cautious bullish punts discussed in 21-May’s Technical Webcast can now be objectively based and managed by shorter-term traders with tighter risk profiles.


This tight but objective short-term risk parameter at 12.16 may come in handy given the proximity to a ton of former 12.74-to-13.02-area support from Jun’17 until Mar’18’s breakdown below this area that left it as a new key resistance candidate shown in the weekly log active-continuation chart below. IF the recovery attempt from 25-Apr’s 10.93 low is a 3-wave (4th-Wave) correction within the still-unfolding secular bear trend, we would expect this immediate area between the (12.58) 38.2% retrace of Jan-Apr’s (suspected 3rd-Wave) decline from 15.25 to 10.93 and that 12.74 – 13.02-range resistance to contain it. Given what has been understandably historically bearish sentiment however as well as a confirmed bullish divergence on 21-May that certainly at least challenges the major bear, traders are likewise urged to acknowledge the possibility of a BASE/reversal-threat environment that could be major in scope.
Factors contributing to a major base/reversal count include:
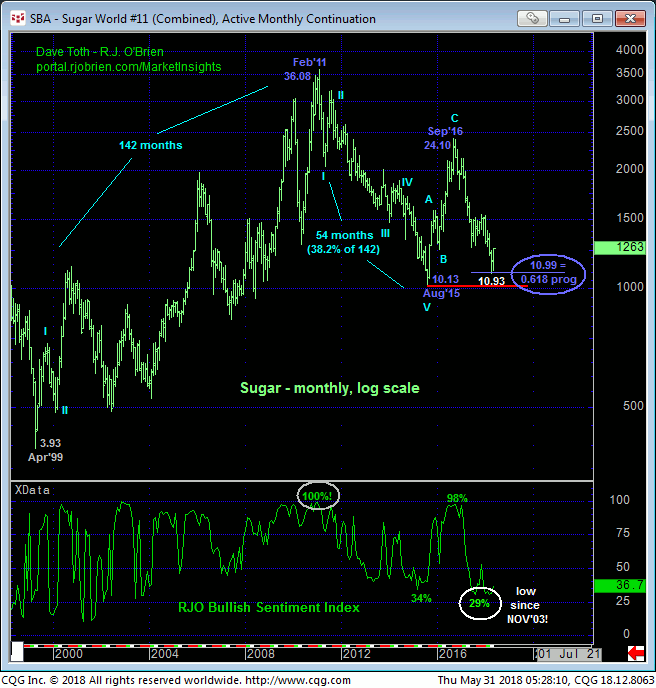
- historically bearish sentiment
- the market’s recent proximity to the extreme lower recesses of the past three years’ range and some of the lowest prices in 10 YEARS
- an arguably complete 5-wave Elliott sequence down from Sep’16’s 24.10 high labeled in the weekly log chart above and
- the Fibonacci fact that the entire 20-month decline from Sep’16’s 24.10 high came with a measly six ticks of being 61.8% of the length of 2011 – 2015’s preceding bear trend from 36.08 to 10.13 shown in the monthly log chart below.
Indeed, it’s not hard to find sound technical reasons to believe this market is just starting a protracted correction or reversal of the past 20-month bear market, especially given market-defined lows like 25-Apr’s 10.93 low and even last Fri’s 12.16 low from which to base non-bearish decisions like short-covers and cautious bullish punts. This said, commensurately larger-degree proof of strength above the 12.74-to-13.02 range remains required for the bull to take that next big step. And as a result of the past couple weeks’ continued recovery, it’s a lot closer to this pivotal threshold than it used to be.
These issued considered, a neutral-to-cautiously-bullish policy remains advised for shorter-term traders with a failure below 12.16 required to move to the sidelines to circumvent the depths unknown of either an interim corrective dip or a resumption of the secular bear trend. Longer-term players remain OK to maintain a cautious bearish policy with a recovery above 13.02 required to threaten this call enough to warrant a move to at least a neutral/sideline position to circumvent the heights unknown of what at that point would be considered a major correction or reversal higher. In effect, we believe the market has identified the 13.02 and 12.16 levels as the key directional triggers heading forward.


