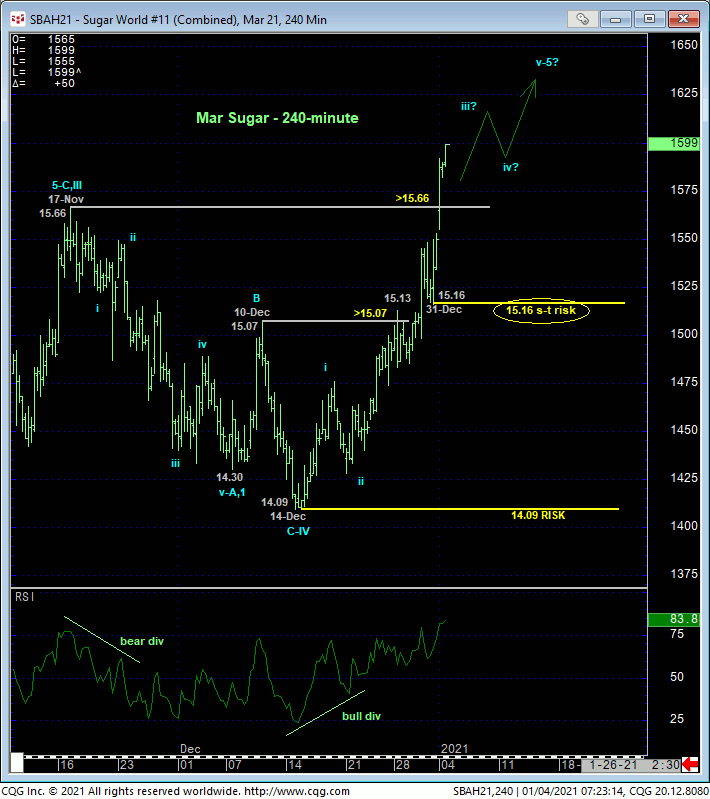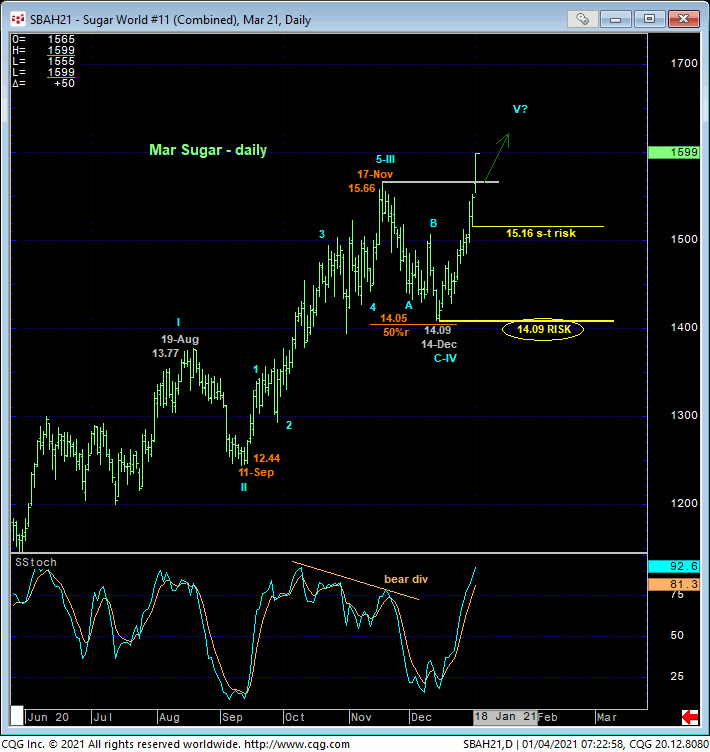

Since 01-Dec’s bearish divergence in momentum discussed in that day’s Technical Blog, we’ve been navigating a correction-vs-reversal debate and challenge. With today’s impulsive break above 17-Nov’s 15.66 high and our key long-term risk parameter, the market has finally settled this debate, confirming Nov-Dec’s sell-off attempt from 15.66 to 14.09 as a 3-wave and thus corrective affair that obviously reinstates this year’s major bull trend.
The important by-products of this resumed strength is the market’s definition of smaller- and larger-degree corrective lows at 15.16 and 14.09 that the bull is required to sustain gains above to maintain a more immediate bullish count. Per such, these levels represent our new short- and long-term risk parameters from which traders can objectively base and manage the risk of a continued or resumed bullish policy and exposure.


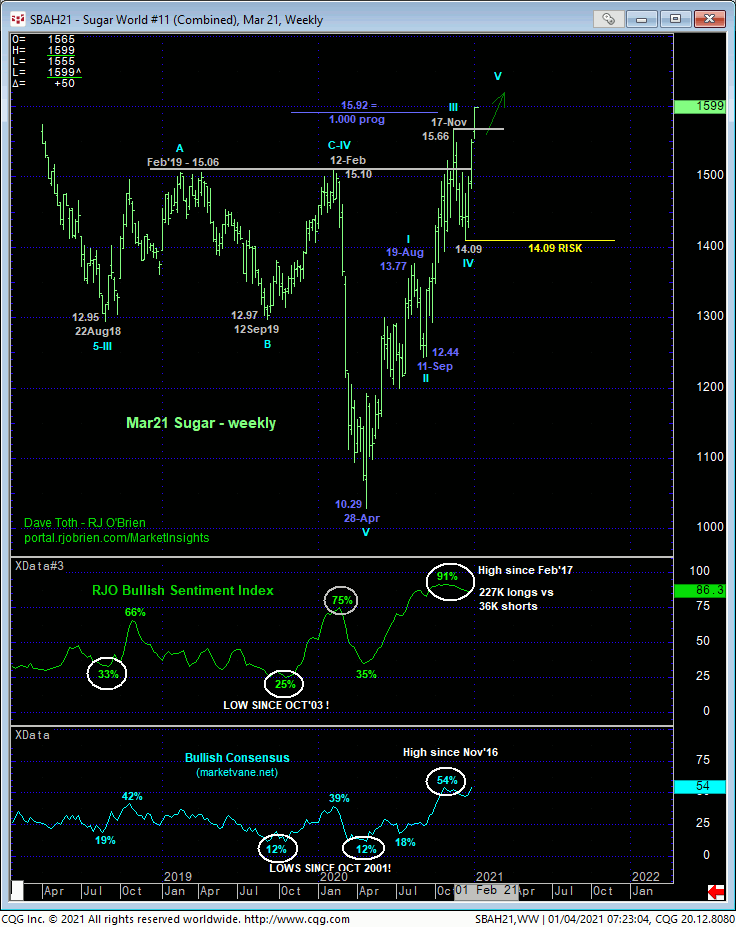
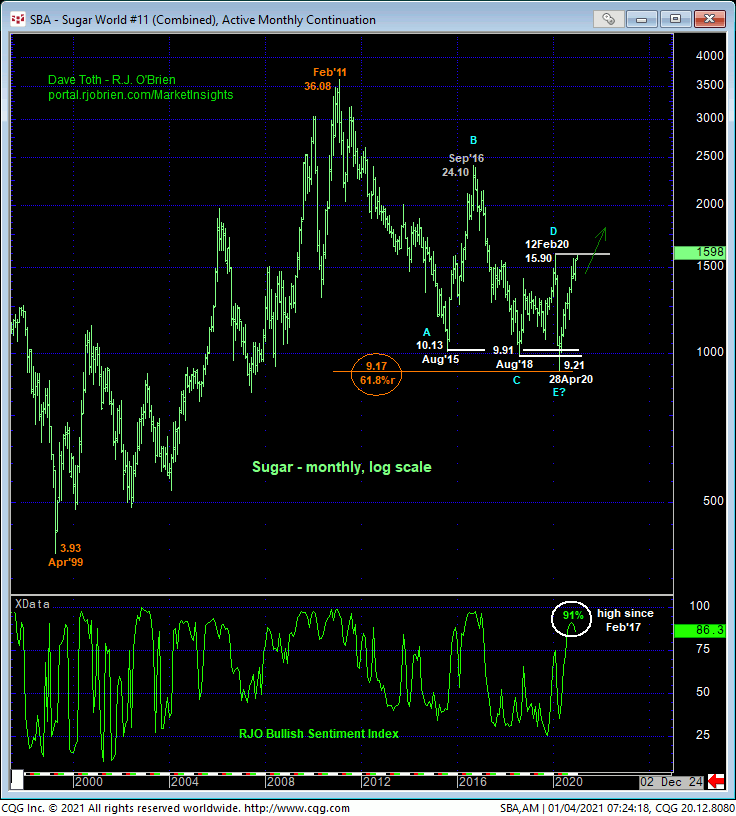
The weekly log scale chart of the Mar contract above and monthly log active-continuation chart below show the sheer magnitude of 202’s major reversal. The trend is up on all scales and should not surprise by its continuance or acceleration. Historically frothy bullish sentiment remains a threat to the bull, but since the market has reinstated the major bull trend, sentiment/contrary opinion is NOT an applicable technical tool in the absence of an accompanying confirmed bearish divergence in momentum. Herein lies the importance of the corrective lows and risk parameters identified above.
Furthermore, by breaking Feb’20’s 15.90 high on an active-continuation basis, the market has broken AT LEAST 2016-2020’s downtrend and possibly the secular bear market from Feb 2011’s 36.08 high. This warns that the market may be in the relatively early stages of a new secular bull market that could span years and produce protracted gains straight away. In fact, by breaking above 15.90 to produce the highest levels in 3-1/2 years, the market has exposed a vast chasm totally devoid of any technical levels of merits shy of Sep 2016’s 24.10 high. This does not mean were forecasting a move to 24.10. But it certainly does mean that until and unless this market arrests the clear and present uptrend with a confirmed momentum failure below specific corrective lows like we’ve defined above, the market’s upside potential is indeterminable and potentially extreme, including a run at a 24-handle or higher. In effect, there is no resistance and the only levels of any technical merit currently exists only below the market in the form of prior corrective lows. Until and unless these lows and risk parameters are broken, further and possibly accelerated gains are expected.
These issues considered, a bullish policy remains advised for shorter-term traders with a failure below 15.16 required to negate this call and warrant its cover. Long-term players displaced by early-Dec’s bearish divergence in momentum are advised to return to a bullish policy on a scale-down from 16.00 to 15.75 with a failure below 15.16 required to pare exposure to more conservative levels and commensurately larger-degree weakness below 14.09 required to jettison the position altogether ahead of another major peak/correction threat. In lieu of such weakness, further and possibly accelerated gains straight away should not surprise.


