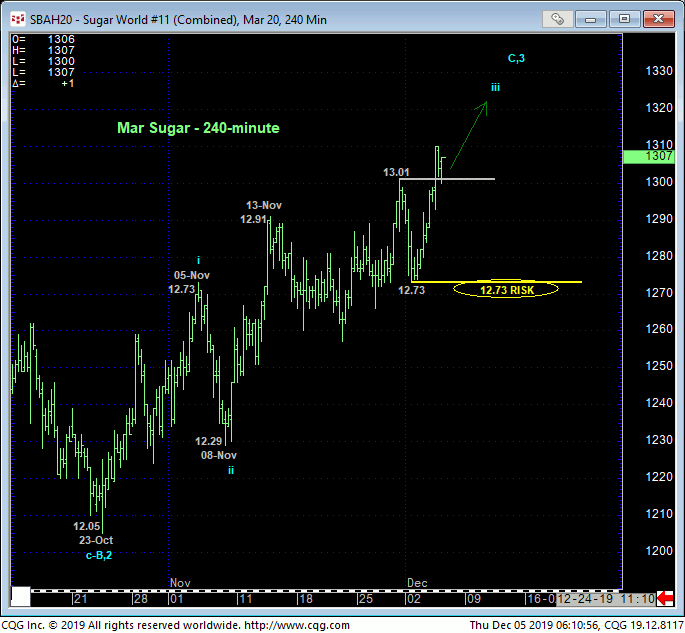
Yesterday’s break above 29-Nov’s 13.01 high reaffirms our major base/reversal count introduced in 24-Sep’s Technical Blog and leaves Mon’s 12.73 low in its wake as the latest pertinent corrective low this market is now minimally required to fail below to even defer this bullish count, let alone threaten it. Per such, this 12.73 level is considered our new key risk parameter to which traders can objectively rebase and manage the risk of a still-advised bullish policy.
Former 13.00-to-12.90-area resistance would be expected to hold as new near-term support ahead of further and possibly accelerated gains straight away.
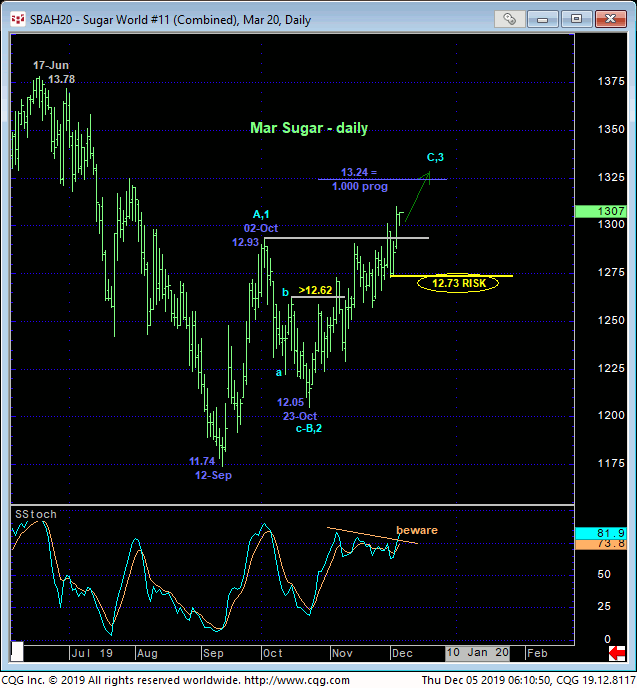
The daily chart above shows last week’s break above 02-Oct’s 12.93 initial counter-trend high that exposes the new longer-term trend as up. Playing the devil’s advocate however and now trying to find flies in the bullish ointment, the recovery attempt from 12-Sep’s 11.74 is only a 3-wave structure THUS FAR. Combined with the market’s position still within the past 15-month lateral range on a weekly log active-continuation basis below, we cannot ignore the possibility that the past quarter’s recovery attempt may only be a larger-degree correction, with the rally from 23-Oct’s 12.05 low being a completing C-Wave of that correction.
IF this alternate bearish count is correct, then somewhere along the line and likely prior to Oct’18’s 14.24 high, the market would/should be expected to stem this clear and present uptrend with a confirmed bearish divergence in momentum. A failure below Mon’s 12.73 corrective low and risk parameter would be considered the start of such a peak/reversal threat.
If our preferred bullish count is correct, then the rally from 23-Oct’s 12.05 low would be the dramatic 3rd-Wave of an eventual 5-wave sequence up that would be expected to produced accelerated and increasingly obvious gains straight away and to what we believe would be multi-year highs. This very bullish count remains predicated on:
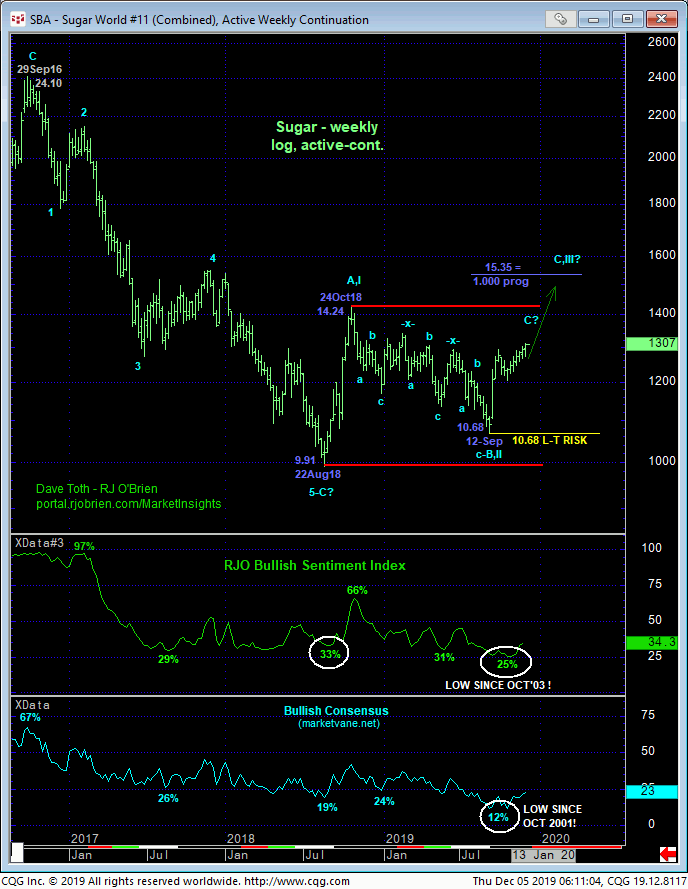
- Oct’18’s bullish divergence in WEEKLY momentum that
- defined Aug’18’s 9.91 low as the END of a 5-wave Elliott sequence down from Sep’16’s 24.10 high
- Oct’18 – Sep’19’s labored, 3-wave, corrective sell-off attempt amidst
- historically bearish sentiment levels unseen for at least 16 YEARS!
Indeed, this is a unique and compelling list of technical facts that has been reinforced by last week’s resumed reversal above 02-Oct’s 12.93 initial counter-trend high in the Mar contract.
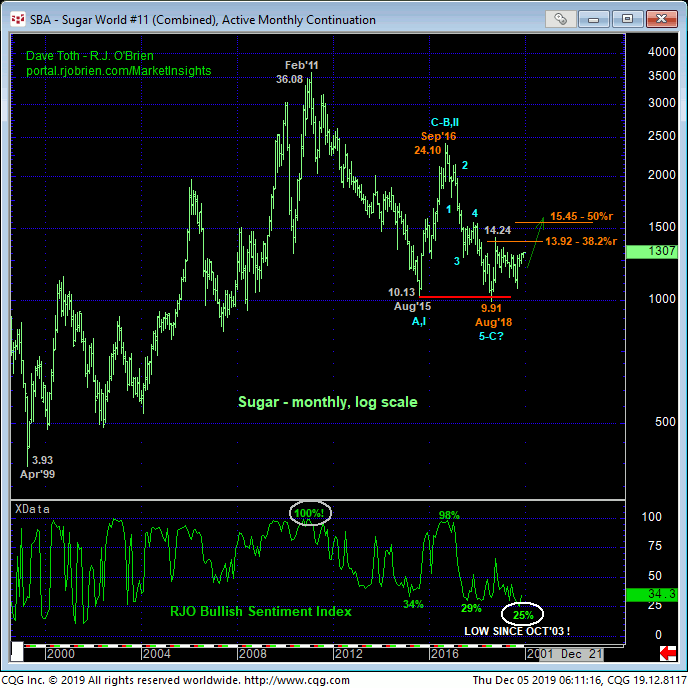
Finally, the monthly log chart below shows the magnitude of the 10.00-area that has supported this market for the past four years. Against the backdrop of a still-arguable secular bear trend from Feb’11’s 36.08 high, even a relatively smaller-degree correction on this scale could produce levels above Oct’18’s 14.24 high and into a 15-handle. And once above that 14.24 high, the market’s upside potential would be indeterminable and potentially severe.
These issues considered, a bullish policy and longs from 12.59 OB recommended in 05-Nov’s Trading Strategies Blog remain advised with a failure below 12.73 deferring or threatening this call enough to warrant its cover. In lieu of at least such sub-12.73 weakness, further and possibly accelerated gains remain expected straight away.