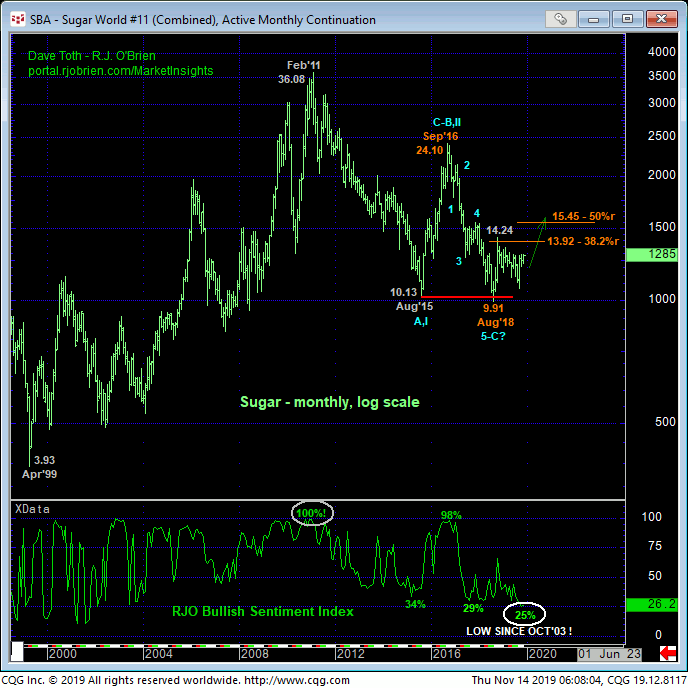
The extent and impulsiveness of yesterday’s break above 05-Nov’s 12.73 high and pressure on 02-Oct’s pivotal 12.93 high is further reinforcing evidence of our major base/reversal count introduced in 24-Sep’s Trading Strategies Blog. As a direct result of this strength, the 240-min chart below shows that the market has identified 12.51 and 12.29 as the latest smaller- and larger-degree corrective lows that it is now required to fail below to threaten and then negate our specific bullish count. Per such, we are defining 12.50 and 12.29 as our new short- and longer-term risk parameters to a still-advised bullish policy and exposure.
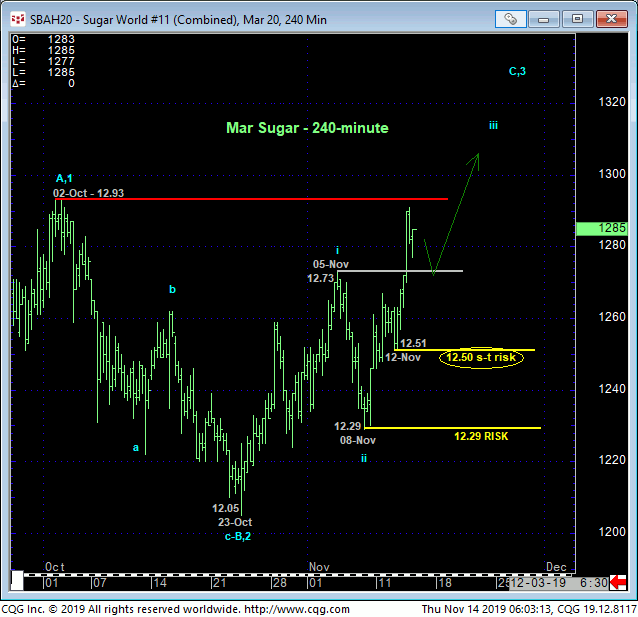
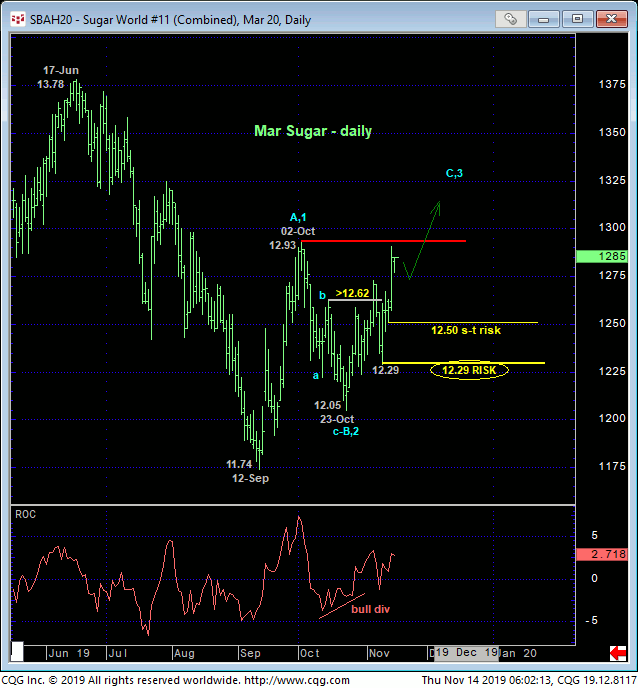
The daily chart above shows yesterday’s spike resuming the uptrend from 23-Oct’s 12.05 low that completed a 3-wave and thus corrective structure that warned of a resumption of Sep-Oct’s uptrend that preceded it. The market’s on the verge of exactly such a 12.93+ bust-out that would reaffirm the break of at least the downtrend from Oct’18’s 14.82 high in the Mar contract shown in the weekly log chart below.
As discussed since late-Sep, this weekly chart also shows historically bearish sentiment/contrary opinion levels that haven’t been experienced since 203 in our RJO Bullish Sentiment Index and since 2001 in the Bullish Consensus (marketvane.net). Such an extent to which the huddled masses have their collective necks sticking out on the bear side warns us of not only better odds of higher prices, but a vulnerability to what could be steep, sustained, even relentless gains in the weeks and months ahead.
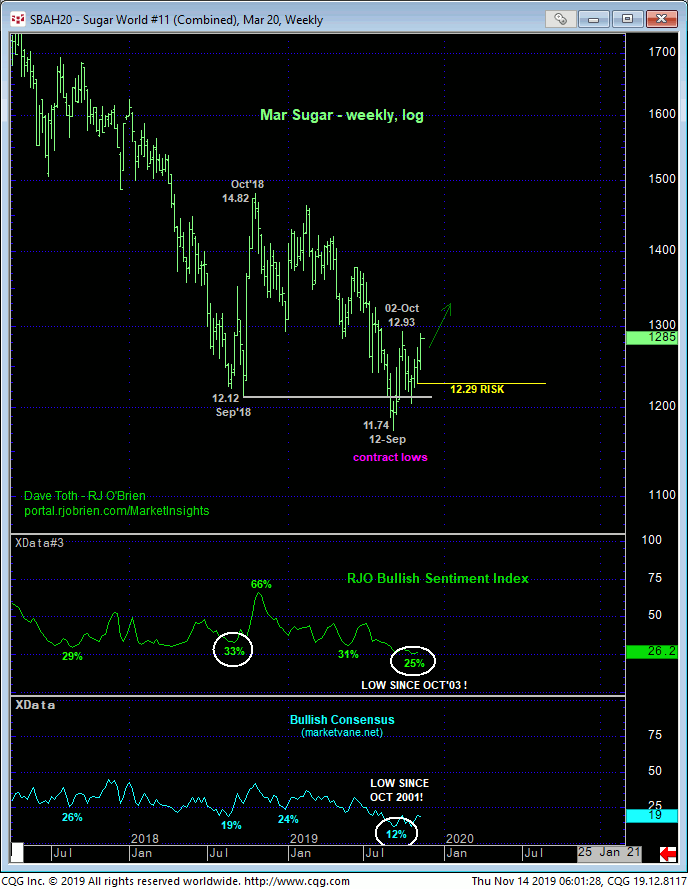
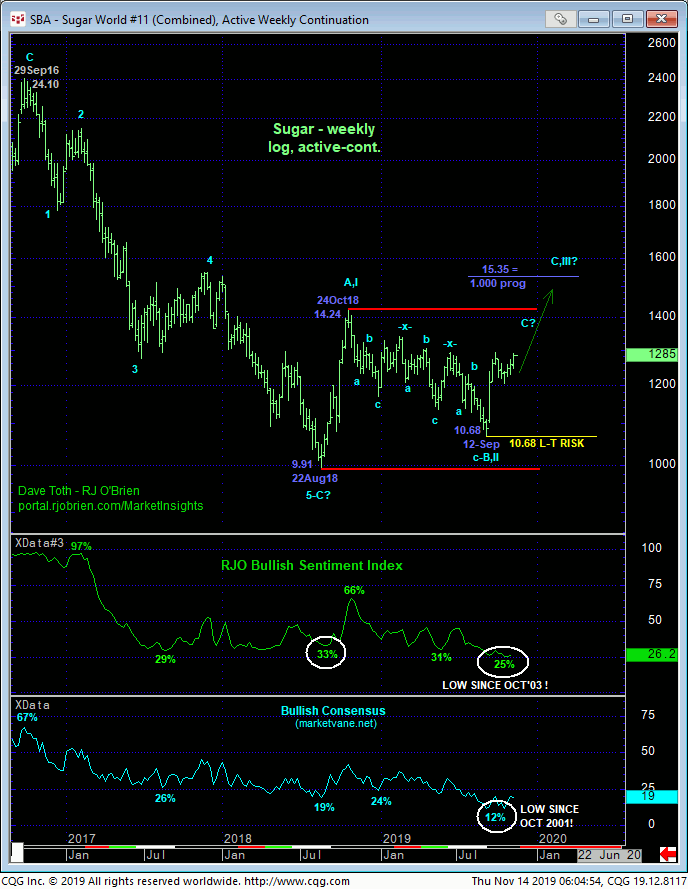
Trying to find flies in the bullish ointment, the weekly (above) and monthly (below) log scale charts show the market still confined to the lateral 14.24 – 9.91-range that has confined it for the past 15 months on an active-continuation basis. Until negated by a 14.24+ bust-out, we cannot ignored the bearish prospect that this mere lateral chop is just a consolidative bear flag ahead of a sub-9.91 resumption of the 9-year secular bear. But if such a bearish count is what the market has in store for us, then somewhere along the line it has got to threaten and then nullify the developing basing behavior of the past two months with specific weakness below corrective lows and risk parameters like 12.50 and 12.29 and 12.05 and 11.74. Until and unless such weakness is proven, there is no way to know that the rally from 12-Sep’s low isn’t a major C- or 3rd-Wave to levels potentially well above Oct’18’s 14.24 high
These issues considered, a bullish policy and longs from 12.59 OB recommended in 05-Nov’s Trading Strategies Blog remain advised with a failure below 12.50 required for shorter-term traders to move to the sidelines. Commensurately larger-degree weakness below 12.29 is required to threaten this call enough for long-term players to take similar defensive steps. In lieu of such weakness, we anticipate a break above 02-Oct’s 12.93 high ahead of further and possibly accelerated gains.
