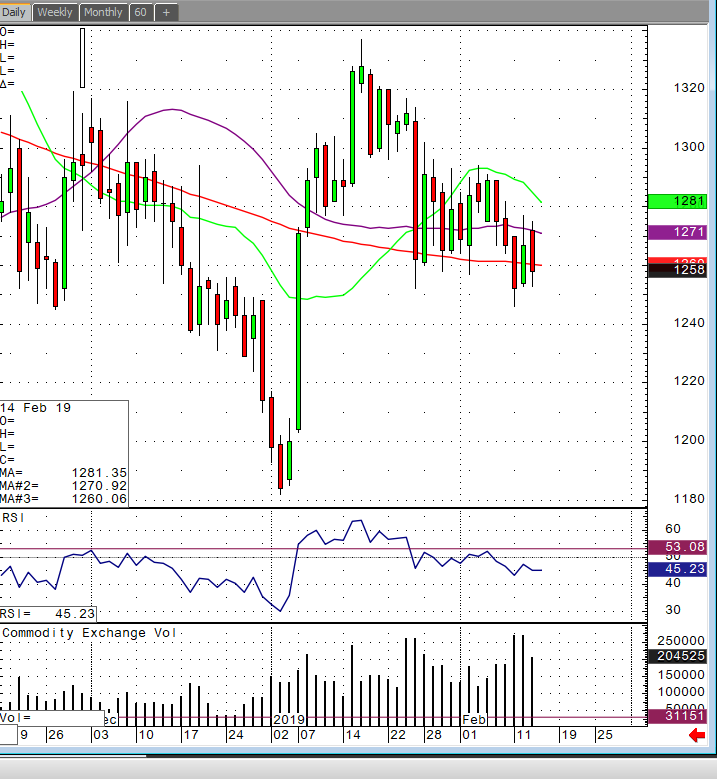
This week’s comment finds sugar right where we left it on our last visit. Recent price action has sugar caught in the same kind of sideways channel as crude oil, but where crude has been drifting higher, sugar has been lilting ever so gently lower. Yet, the story remains the same. Fundamentally, market watchers anticipate this year’s production to decrease and for surplus to be eased if not erased. Today’s Hightower comment highlighted second half January output in Brazil up by 1,000 tonnes according to UNICA. A small increase, but this could be just the start. However, if global production does decrease and the result is a deficit, sugar will likely have to rally. According to Hightower’s take on the COT for the week of Jan 15, the fund trader category is short nearly 50,000 contracts. This is not the giant short position commentators were looking for but there could be distortion due to the delay in COT reports.
Technically, the chart looks to be rolling over. Recall that around the first of the year sugar was able to post quite a rally. Almost 9 days of positive price action carried the May contract from below 12.00 to almost 13.40. Since then sugar has been in a funk, giving back half of the rally from the beginning of the new year. The 18-day moving average comes in at 12.80. Today, 2/13/19, May sugar closed at 12.58. Closes above the 18-day will signal the market sees production deficits coming up. Failure to get back above the 18-day will leave the market under pressure and will embolden the commodity trading funds to increase their short positions. I still think traders could use puts to establish short positions as we move into the spring with closes above 13.00 to serve as a fine level for risk management.
If you would like to learn more about softs futures, please check out our free Fundamentals of Softs Futures Guide.
Sugar May 19 Daily Chart


