
Posted on Oct 25, 2022, 08:49 by Dave Toth
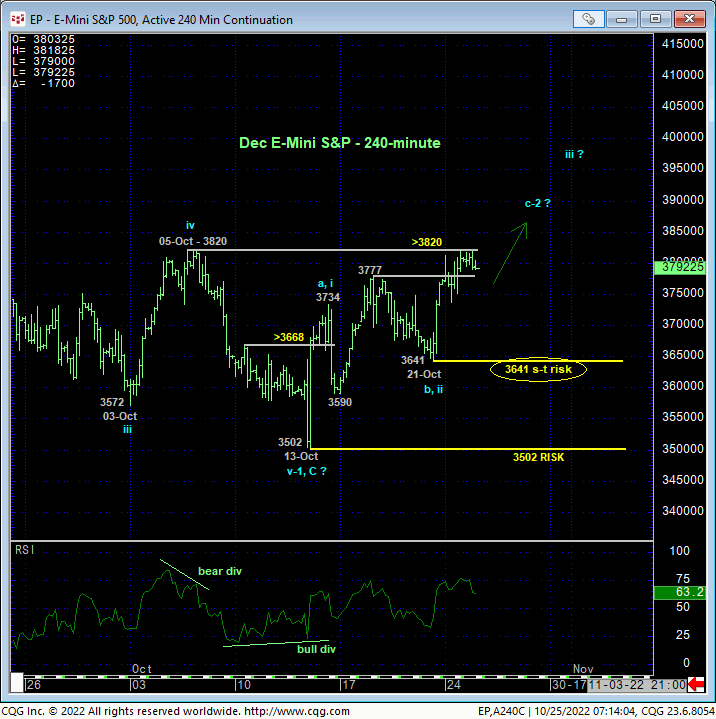
Fri’s continued recovery above last Tue’s 3777 high reinforces our interim bullish count introduced in 13-Oct’s Technical Blog calling the recovery attempt from 13-Oct’s 3502 low another correction within this year’s major bear market. As we’ll discuss below, yesterday’s poke above 05-Oct’s 3820 larger-degree corrective high confirms a bullish divergence in daily momentum that defines 13-Oct’s 3502 low as the end of a textbook 5-wave Elliott sequence down 16-Aug’s 4328 key high, exposing a (suspected 2nd-wave) correction of Aug-Oct’s 4328 – 3502 decline.
The crucially important by-products of the past week-and-a-half’s recovery attempt are the market’s definition of lows and support at 3641 from Fri and obviously 13-Oct’s 3502 low. If our long-term bearish analysis is totally wrong and Jan-Oct’s 27% decline is a complete correction ahead of a more protracted, sustained rally, then the bull simply needs to BEHAVE LIKE ONE and sustain trendy, impulsive behavior higher and above these two specific levels at 3641 and especially 3502. The market’s failure to do so will not only mitigate any broader bullish prospects, but also reinforce our major bearish count that still warns of a potential meltdown similar to 2007-2009’s 56% bear market. Per such, 3641 and 3502 serve as our new short- and longer-term risk parameters from which non-bearish decisions like short-covers and cautious bullish punts can be objectively based and managed.
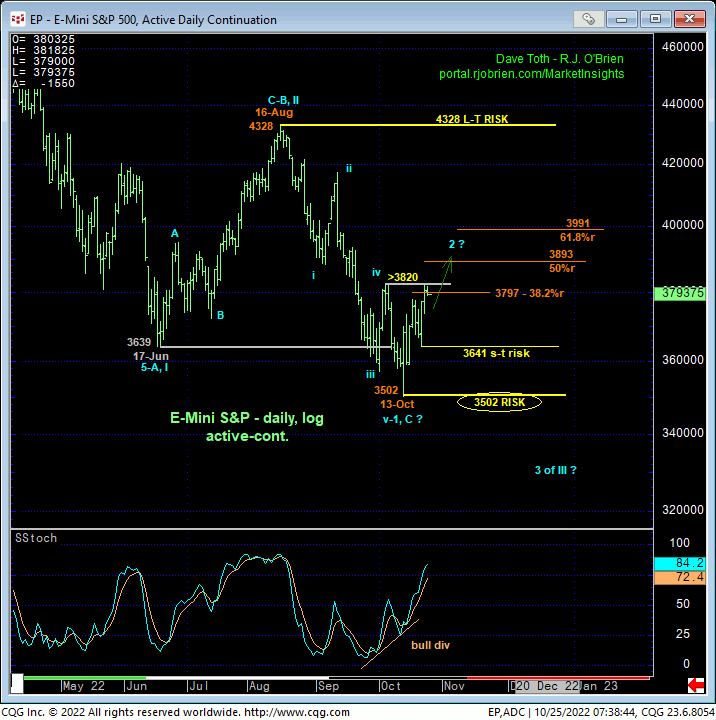
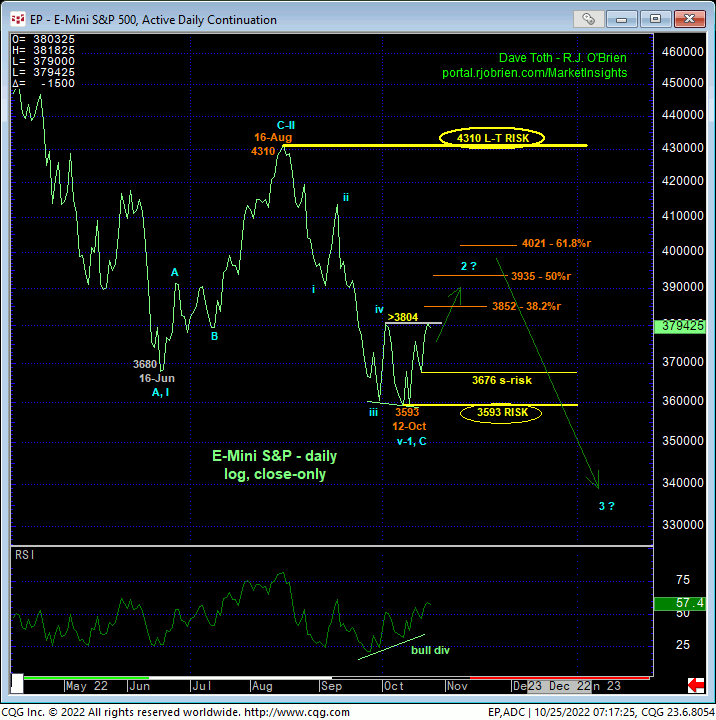
Stepping back a bit, the daily log high-low chart above and daily log close-only chart below show yesterday’s confirmed bullish divergence in momentum as a result of the market’s recovery above 04/05-Oct’s corrective highs and likelihood that 12/13-Oct’s lows competed a nice 5-wave Elliott sequence down from 16-Aug’s 4328 high. This combination is an important one because it identifies market-defined LOWS and support at 3641 and 3593 specifically that the market is now required to sustain gains above if there’s something broader to the bull side in store. In effect, these levels are THE risk parameters from which non-bearish decisions like short-covers and bullish punts can be objectively based and managed. Failures below these levels will threaten and then negate any bullish prospects and reinforce our preferred and long-term bearish count that could have monstrous downside implications in the months and quarters ahead.
For what it’s worth and in the exact same discipline we attacked Jun-Aug’s bear market rally, we’ve marked the 38.2%, 50% and 61.8% retracements of Aug-Oct’s decline at levels ranging from 3797 to 4021. As always, such merely ‘derived” so-called “technical levels” like tend lines, Bollinger Bands, imokus, the ever-useless moving averages and even the vaunted Fibonacci relationships we cite often in our analysis are of little note in the absence of an accompanying confirmed bearish divergence in momentum now needed to arrest the current developing recovery.
In 22-Aug’s Technical Blog, four trading days AFTER the market rejected the exact 61.8% retrace of Jan-Jun’s downtrend, the market confirmed a bearish divergence in short-term momentum that rendered that retracement APPLICABLE to the navigation of the suspected end/top to that bear market correction. 2022’s bear market resumed thereafter with another 19% decline. We will exact that same discipline to the current recovery attempt, and herein lies the importance of recent corrective lows like 3641 and subsequent lows yet to be defined by this recovery. Until and unless the market stems this recovery with such a countering momentum failure, further gains are expected. The RISK on non-bearish decisions like short-covers and cautious bullish punts has been precisely defined.
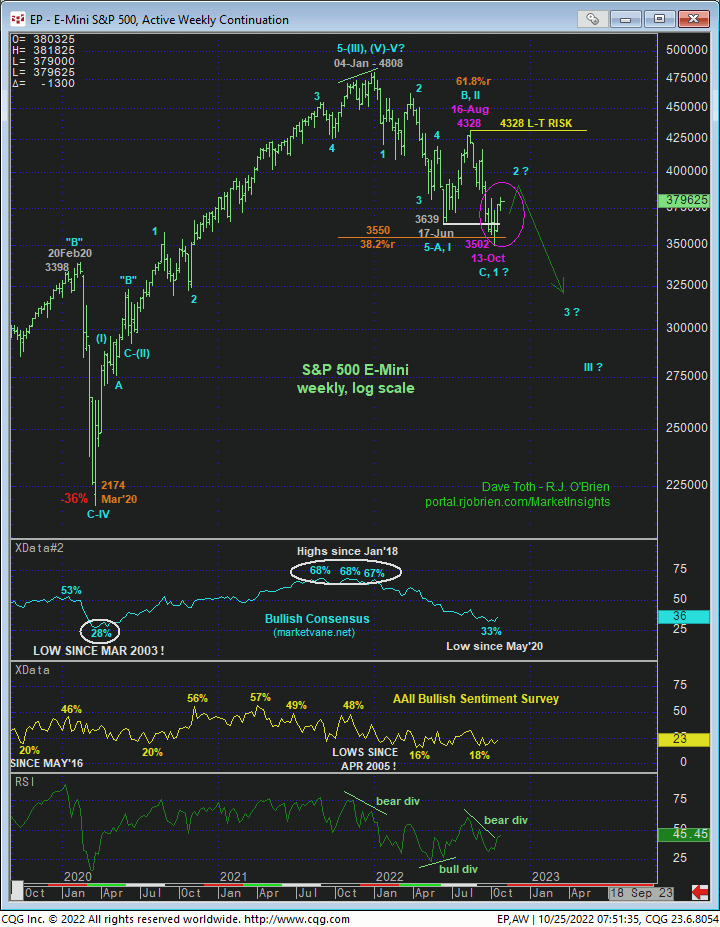
From an even longer-term perspective, the prospective bull’s ability to behave like one may never be as important as it is in the period immediately ahead as the past couple weeks’ recovery falls well within the bounds of another mere correction within a MAJOR BEAR MARKET. We often discuss technical and trading SCALE. Traders and investors must acknowledge that given the extent of this year’s 27% decline, 16-Aug’s 4328 larger-degree corrective high remains intact as THE long-term risk parameter this market is still required to recoup to, in fact, break this year’s downtrend and mitigate our long-term peak/reversal elements. A recovery attempt shy of 4328 remains well within the bounds of a mere correction within the secular bear trend that has indeterminable and potentially severe downside potential in the months and quarters ahead.
Since 20-Jan’s bearish divergence in WEEKLY momentum, we’ve related this market’s major peak/reversal-threat elements and bearish prospects to those that warned of and accompanied 2007’s massive top that led to an eventual 17-month, 56% bear market. Thus far, this year’s price action down from Jan’s 4808 all-time high has been a mirror image of the EARLY stages of 2007 – 2009’s collapse. Below is the weekly log scale chart of that entire previous bear market. As discussed back in late-Jun this year following a bullish divergence in momentum, we anticipated a bear market correction similar to Mar-May’08’s (2nd-Wave) correction of Oct’07 – Mar’08’s initial 1587 – 1253 decline. This year’s Jun-Aug 61.8% retracement of Jan-Jun’s 1st-Wave decline was virtually identical to that Mar-May 2008 correction before that major bear trend continued.
We direct traders’ attention to Jul – Aug’08’s 4-week, 4% bounce and exact 50% retrace of May-Jul’08’s 1441 – 1263 portion of that bear that CAME AFTER Jul’08’s break below Mar’08’s pivotal 1253 1st-Wave low. Comparing this behavior to today, the weekly log chart above shows the market trying to rebound AFTER breaking 17-Jun’s pivotal 1st-Wave low at 3639. Is it possible that Aug-Oct’s decline from 4328 to 3502 is the completing c-wave to a major BULL market correction? Yes. BUT IF this is the case, then, again, the bull needs to BEHAVE LIKE ONE by sustaining trendy, impulsive, increasingly obvious behavior higher in the weeks immediately ahead. A countering bearish divergence in short-term momentum will be the first strike against such a count. A subsequent failure below 3641 will be strike two. Further weakness below 3502 will not only be strike three to any/all bullish hopes, but also reaffirm the secular bear and expose potentially massive losses thereafter.
We would also remind long-term traders and investors that throughout 2007 – 2009’s entre 17-month, 56% drawdown, 15 of those months saw very volatile 2-steps-down-1-step-up behavior. The brunt of that bear unfolded in a very concentrated 2-month period that followed Jul-Aug’08’s corrective hiccup when the market collapsed 36%. THIS is the proverbial other shoe that we believe remains to be dropped on this market. And we believe odds will increase for such an eventuality if this market fails on the current recovery attempt below levels like 3641 and especially 3502.
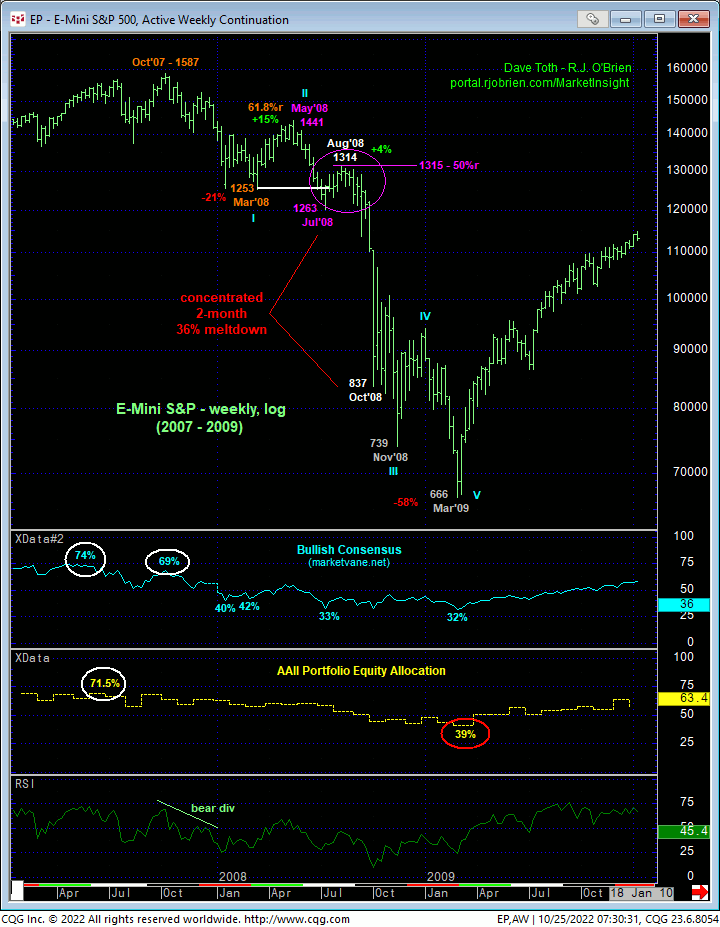
Finally and once again, we remind long-term players and investors of the technical facts and elements on which our major peak/reversal count is predicated:
- bearish divergences in weekly and monthly momentum back in Jan/Feb
- “outside week, month AND QUARTER” the week, month and quarter of Jan’s 4808 high
- historically
extreme bullish sentiment around the Jan high
- Bullish Consensus (marketvane.net)
- portfolio stock allocation
- portfolio stock-to-cash ratio
- inverted Treasury yield curve
- complete and massive 5-wave Elliott sequences up from Mar’20’s 2192 low and 2009’s 666 low.
This was and remains a unique and compelling list of technical facts and observations that warned of and accompanied 2018 – 2020’s major correction and both the 2007 – 2009 and 2000 – 2002 major bear markets. To mitigate these elements from a long-term perspective, the market needs to recoup 16-Aug’s 4328 high. Recovery attempts shy of 4328 fall well within the bounds of another correction within a bear market of indeterminable scope in the months and quarters ahead.
These issues considered, traders have been advised to move to an interim neutral-to-cautiously-bullish stance with a failure below 3641 required to threaten this call enough to warrant moving back to a bearish policy. In lieu of such weakness, further lateral-to-higher prices remain anticipated. we will, of course, be keeping a keen eye on MOMENTUM in the week or two ahead, with a recovery-stemming bearish divergence rejecting/defining a more reliable high from which a resumed bearish policy can be objectively re-pursued.


