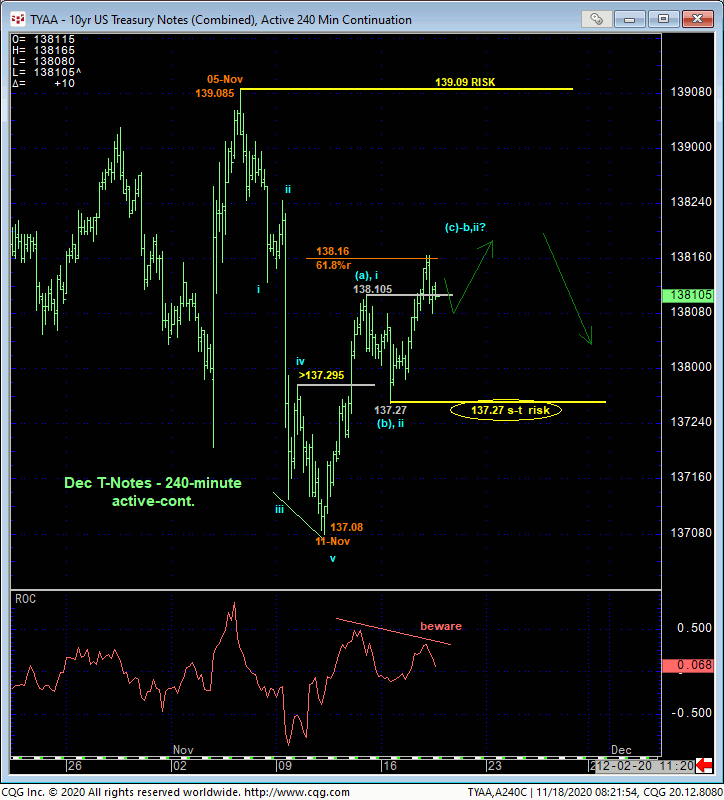
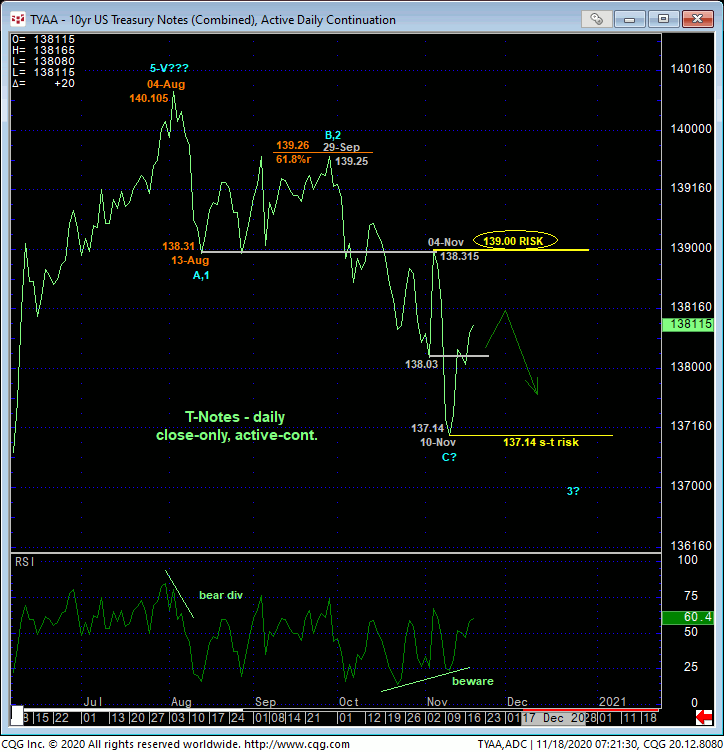
DEC 10-Yr T-NOTES
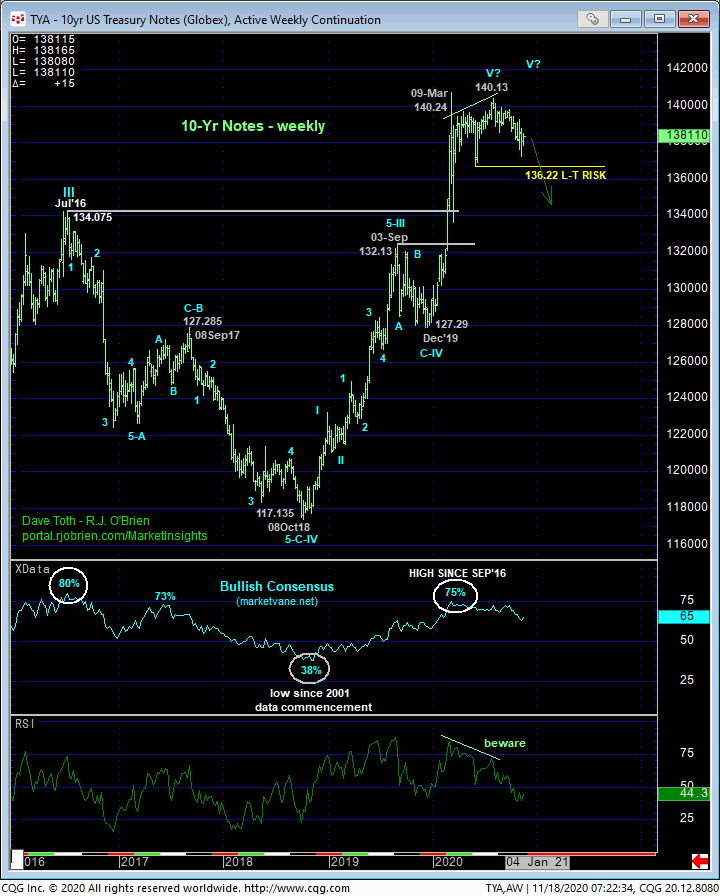
Yesterday afternoon and overnight’s continued recovery above Fri’s 138.105 high reaffirms the intermediate-term recovery and leaves Mon’s 137.27 low in its wake as the latest smaller-degree corrective low the market is now required to sustain gains above to maintain a more immediate bullish count. Its failure to do so will not only confirm a bearish divergence in momentum, but also reinforce our preferred broader bearish count by exposing the recovery from 11-Nov’s 137.08 low as a 3-wave and thus (bear market) corrective structure.
The Fibonacci fact that this recovery has reached the (138.16) 61.8% retrace of early-Nov’s 139.085 – 137.08 decline could prove to be a reinforcing factor to a resumed bearish count. But the key is still a short-term mo failure below 137.27. Per such, 137.27 is considered our new short-term risk parameter from which shorter-term traders with tighter risk profiles can objectively rebase and manage non-bearish decisions like short-covers.
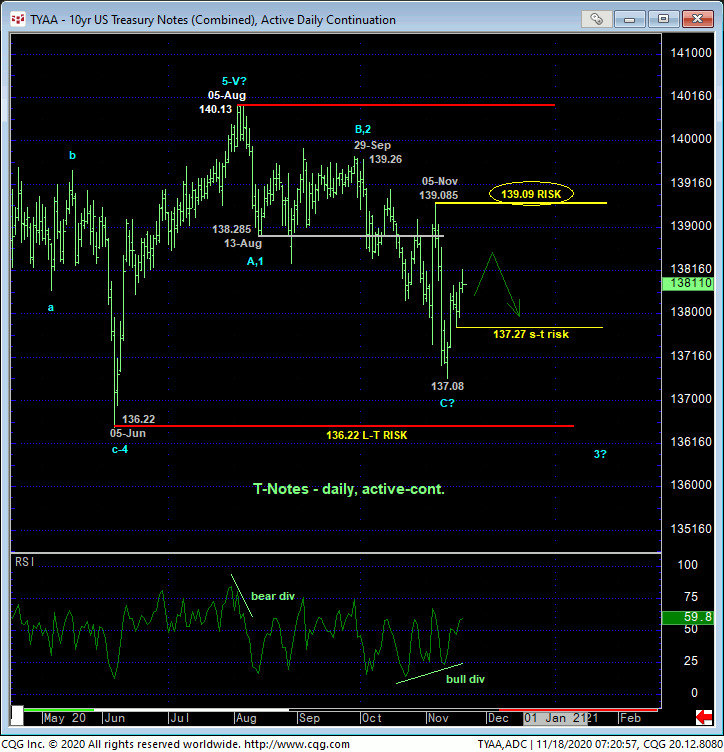
From a longer-term perspective, the past week’s recovery attempt remains well within the bounds of a mere correction within a multi-month PEAK/correction/reversal count. THUS FAR, the sell-off attempt from early-Aug’s highs has only unfolded into a 3-wave affair and cannot be totally dismissed as a larger-degree correction within the secular BULL market. HOWEVER, commensurately larger-degree strength above 05-Nov’s 139.085 larger-degree corrective high and key risk parameter remains minimally required to CONFIRM Aug-Nov’s sell-off as a 3-wave and thus corrective event that would then re-expose the secular bull. Until such strength is shown, longer-term institutional players remain advised to first approach the current recovery attempt as another corrective selling opportunity.
On a 10-yr yield basis shown in the daily log close-only chart below, the longer-term risk parameter analogous to our 139.09 corrective high in the contract is 04-Nov’s 0.76% corrective low. This is the yield level the market needs to break to expose Aug-Nov’s rate recovery as a 3-wave and thus corrective structure that could then re-expose the generational-long decline in rates. By the same token, the past week’s rate relapse defines 10-Nov’s 0.965% high as THE key short-term level the market needs to recoup to resurrect not only a 3-month base/reversal count, but also the developing potential for a major reversal of a generation’s worth of declining rates.
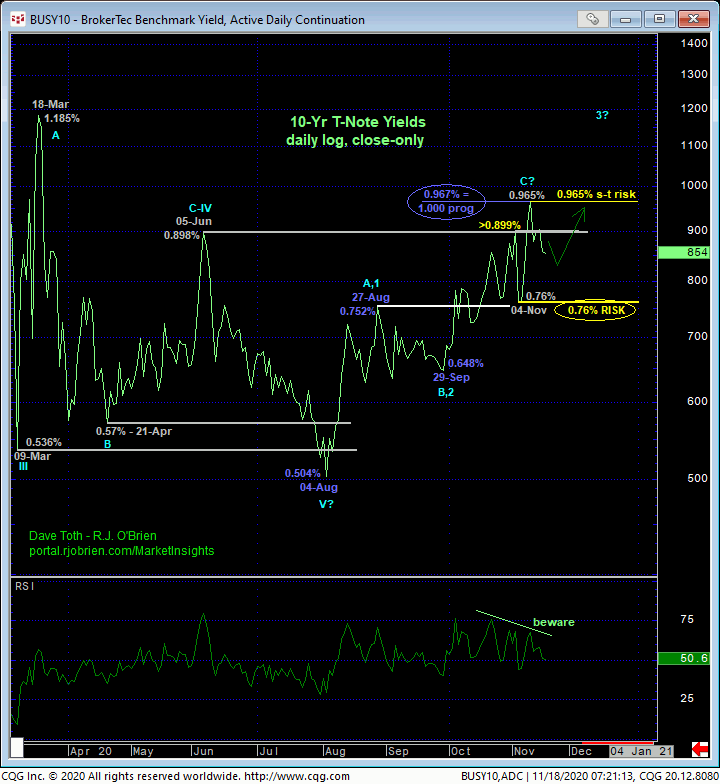
Finally and as discussed often these past few months, the weekly chart f the contract below shows the technical trifecta on which our major peak/reversal count is predicated:
- upside momentum that’s been waning for most of this year
- historically frothy levels in the Bullish Consensus (marketvane.net) measure of market sentiment that haven’t been seen since those that warned of and accompanied Jul’16’s major peak/reversal and
- the prospect of a complete 5-wave Elliott sequence from Oct’18’s 117.13 low to 05-Aug’s 140.13 high.
If correct, reinforced by resumed weakness below 137.08, a protracted decline in terms of both price and time would be expected. A multi-quarter or even multi-YEAR correction or complete reversal of at least the Oct’18 – Aug’20 bull market could follow.
These issues considered, a neutral/sideline policy remains advised for shorter-term traders with a bearish divergence in short-term momentum required to arrest the past week’s rebound and present another favorable risk/reward opportunity from the bear side. A bearish policy and exposure remain advised for long-term players with a close above 139.00 or an intra-day move above 139.08 required to negate this call and warrant its cover. In lieu of such strength and especially after a relapse below 137.27, we anticipate a resumption of the 3-month peak/reversal process ahead of eventually sharp, sustained losses that become increasingly obvious.
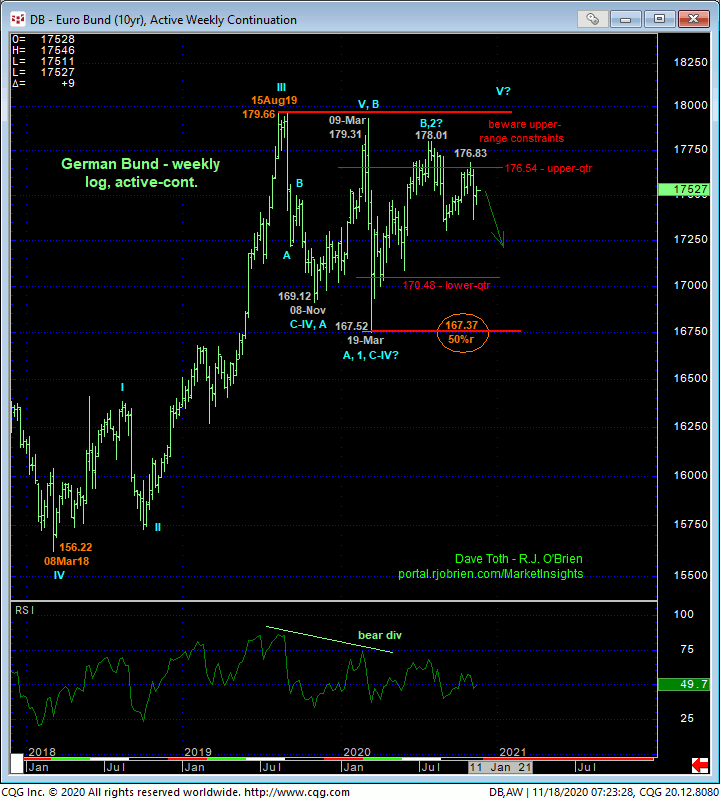
DEC GERMAN BUNDS
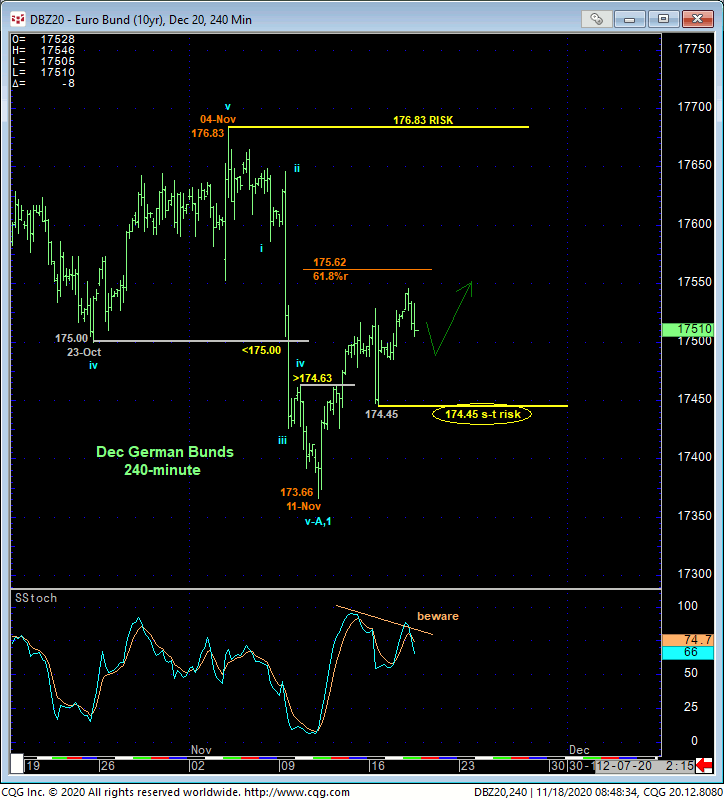
Similarly, yesterday’s continued rebound in the bunds leaves Mon’s 174.45 low in its wake as the latest smaller-degree corrective low the market now needs to sustain gains above to maintain a more immediate bullish count. Its failure to do so will confirm a bearish divergence in short-term momentum, arrest the past week’s recovery as a suspected 3-wave and thus corrective affair, and re-expose early-Nov’s downtrend that preceded it. Per such, this 174.45 level serves as our new short-term risk parameter from which shorter-term traders with tighter risk profiles can objectively rebase and manage non-bearish decisions like short-covers and cautious bullish punts.
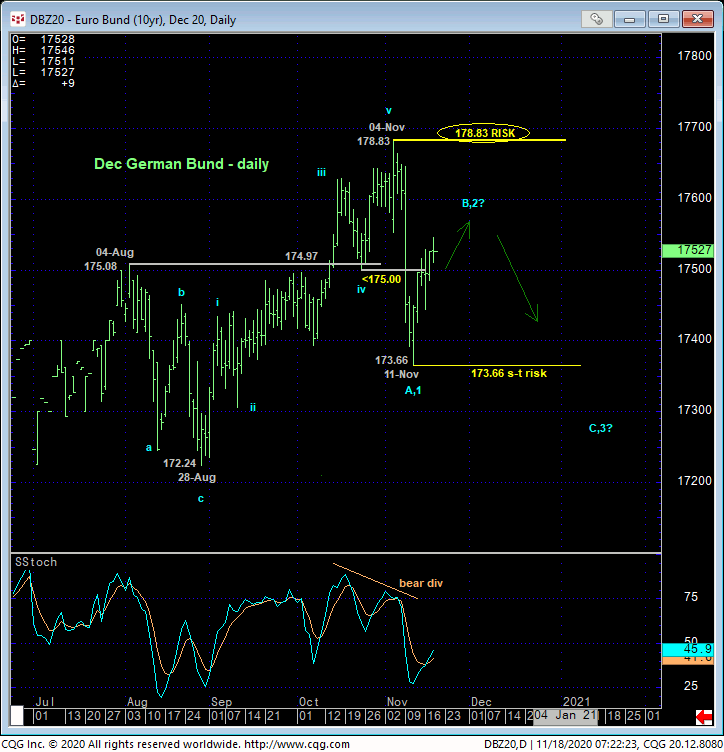
From a longer-term perspective, the following facts and observations contribute to a broader peak/correction/reversal threat:
- early-Nov’s bearish divergence in daily momentum from
- the upper-quarter of the past 15-month lateral range and
- a complete 5-wave Elliott sequence up from 28-Nov’s 172.24 low.
If correct, then these elements warn that the current recovery attempt is a correction within a broader move south that would be expected to be stemmed by a bearish divergence in short-term mo from somewhere between spot and 04-Nov’s 176.83 key high and long-term bear risk parameter. Herein lies the importance of Mon’s 174.45 low and short-term risk parameter, the break of which will CONFIRM the divergence to the point of bearish action and leave whatever high is left in the wake of that failure as our new short-term risk parameter from which a resumed bearish policy and exposure can be objectively based and managed.
In sum, a bearish policy and exposure remain advised for long-term institutional players withy a recovery above 176.83 required t negate this call and warrant its cover. Shorter-term trader are advised to maintain a neutral/sideline policy and be on the lookout for a bearish divergence in short-term mo from around current lower-175-handle-area prices for a return to a bearish policy.