Posted on Dec 08, 2022, 06:56 by Dave Toth
Yesterday’s break above last Fri’s 114.285 high reaffirms our base/correction/reversal count introduced in 10-Nov’s Technical Webcast and leaves Mon’s 113.25 low in its wake as the latest smaller-degree corrective low this market is now minimally required to fail below to even defer, let alone threaten what has become an increasingly sizeable and impressive month-and-a-half-long recovery. Per such, this 113.25 level serves as our new short-term risk parameter from which shorter-term traders with tighter risk profiles can objectively rebase and manage the risk of a still-advised bullish policy and exposure. Reinforcing this level, the 240-min chart below also shows this 113.27-to-113.19-area to be a key one of former resistance-turned-support.


On a broader scale, the daily chart of the contract (above) shows this market retracing nearly half of Aug-Oct’s entire 122.02 – 108.265 plunge. The trend is clearly up on this daily scale, but given the backdrop of a 26-month secular bear trend and the developing potential for a bearish divergence in momentum, we cannot ignore the still-long-term-bearish prospect that the recovery from 21-Oct’s 108.265 low is just a slightly larger-degree bear market correction.
A short-term mo failure below 113.25 would not be of a sufficient scale to conclude the end of this 7-week rally. Indeed, commensurately larger-degree weakness below 27-Oct’s 111.31 suspected 1st-Wave high is now required to jeopardize the impulsive integrity of a broader and more immediate bullish count, render this recovery a 3-wave and thus corrective affair and re-expose the secular bear. Per such, this 111.31 level is considered our new long-term bull risk parameter pertinent to longer-term institutional players.
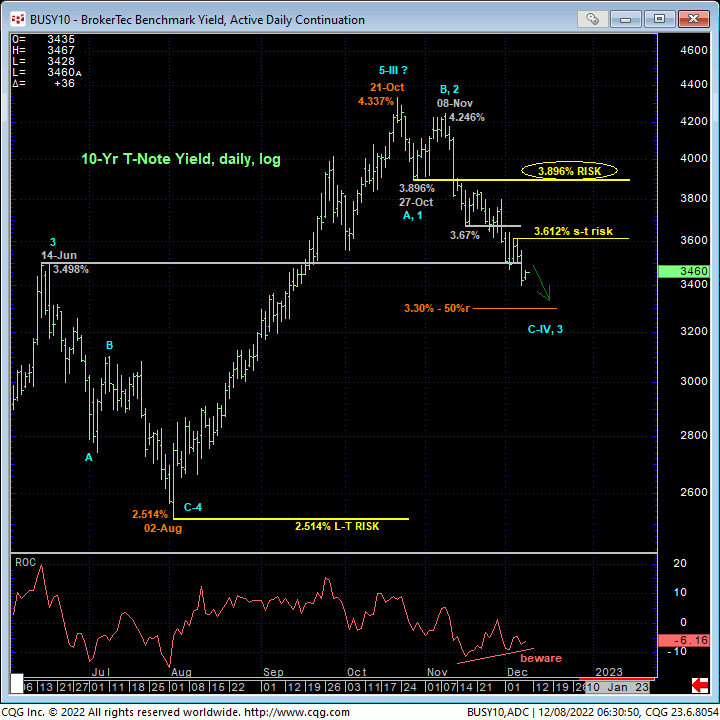
From an inverted 10-yr yield basis below, the analogous short- and long-term bear risk parameters cut across at 3.612% and 3.896%, respectively.

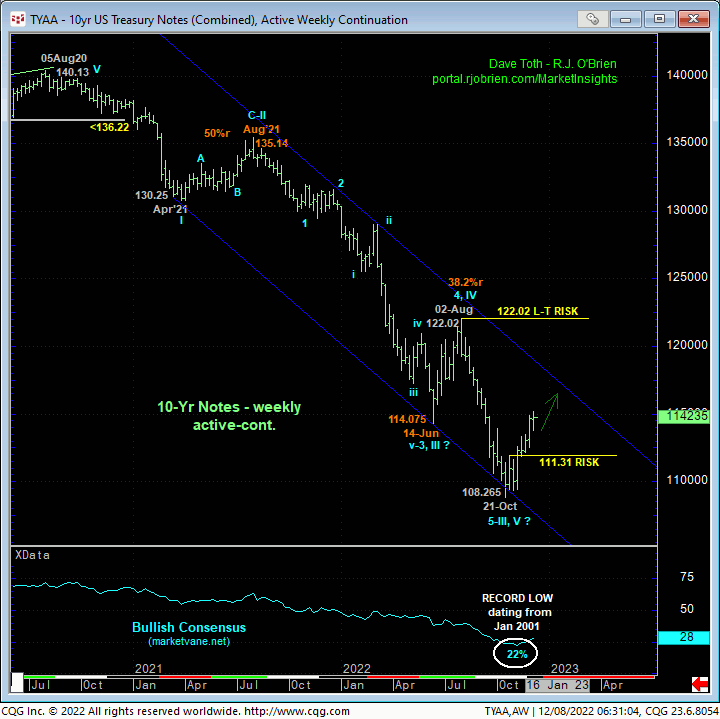
Finally and from an even longer-term perspective, the weekly chart of the contract below shows this recovery stemming not only from the lowest Bullish Consensus (marketvane.net) level on record, but also from an arguably complete and massive 5-wave Elliott sequence down from Aug’20’s 140.13 high. If correct, the base/correction/reversal of this 26-month, 380-bp bear market could span quarters or even more than a year. And if we’re in the early stages of such a recovery, the market would not only be expected to sustain trendy, impulsive behavior up above levels like 111.31 and even 113.25, but to accelerate higher straight away.
These issues considered, a bullish policy and exposure remain advised with a failure below 113.25 required for shorter-term traders to neutralize exposure and commensurately larger-degree weakness below 111.31 for longer-term institutional players to follow suit. In lieu of such weakness, further and possibly accelerated gains are anticipated.


