DEC 10-Yr T-NOTES
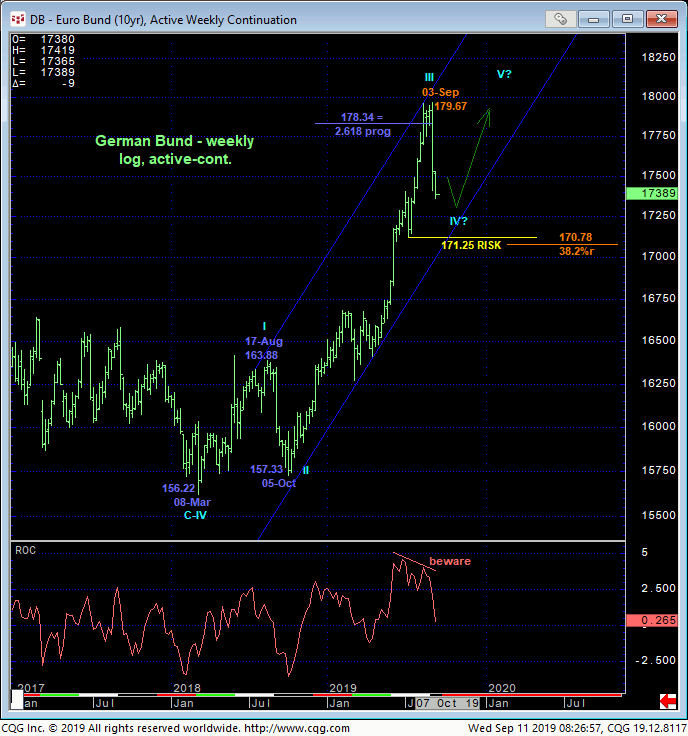
The 240-min chart below shows the past few days’ continued sell-off following 05-Sep’s bearish divergence in momentum below 131.13 discussed in that day’s Technical Webcast that leaves Fri’s 131.155 high in its wake as the latest smaller-degree corrective high the market is now required to sustain losses below to maintain a more immediate bearish count. In this very short-term regard, 131.16 may be considered a micro risk parameter from which non-bullish decisions like long-covers and cautious bearish punts can be objectively rebased and managed by short-term traders.
Needless to say, 03-Sep’s 132.13 high remains intact as one of developing importance and the short-term but key risk parameter the market needs to recoup to confirm our longer-term suspicions that the decline from that high is just a larger-degree correction within the secular bull trend.
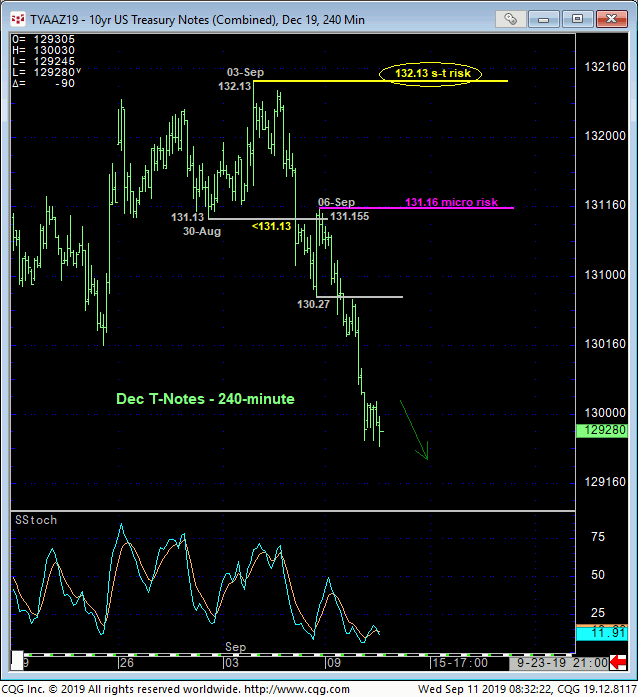
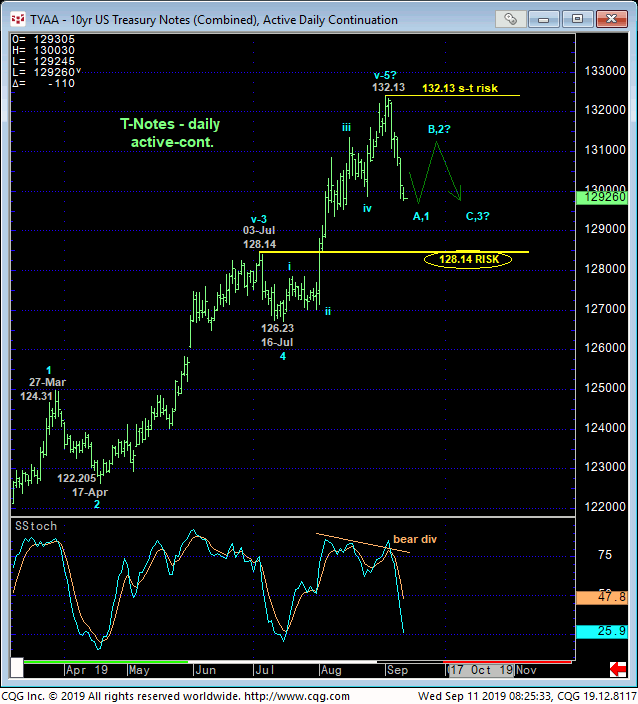
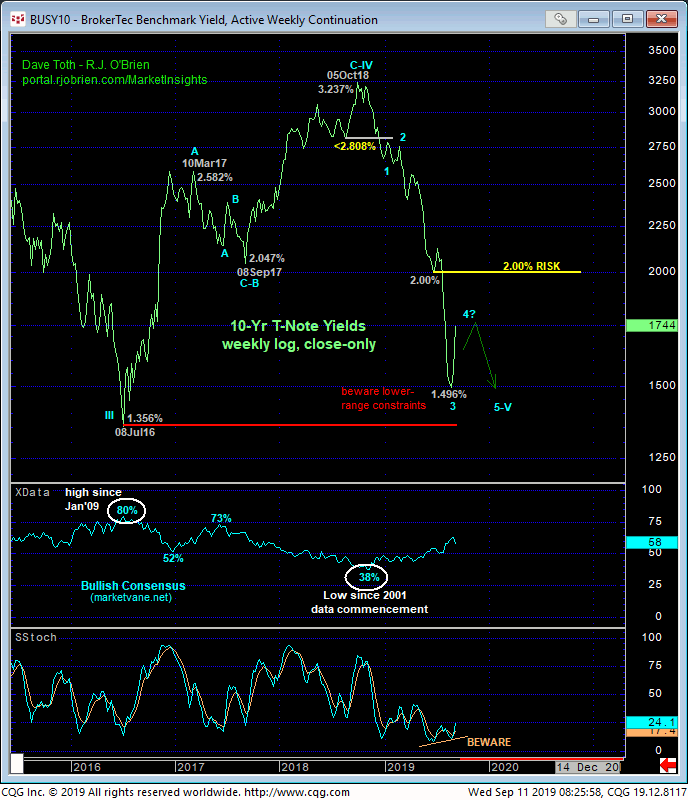
It’s important to make this SCALE distinction. For while the bearish divergence in DAILY momentum in the daily chart of the contract above and bullish divergence in daily 10-yr rates below clearly counter the past 11-months’ trend, this counter is thus far only of a scale that allows us to conclude the end of the trend from 16-Jul’s 126.23 low in the contract and 11-Jul’s 2.15% high in rates. Commensurately larger-degree weakness below at least former 128.14-area resistance-turned-support (above 1.931% support-turned-resistance in rates) and preferably 16-Jul’s 126.23 next larger-degree corrective low remains required to even threaten, let alone break the major uptrend.
Additionally, whether the past week’s break is a correction or start of a major reversal, all of the factors behind the past 11-month rally aren’t likely to evaporate into thin air. From a technical perspective, this warns of AT LEAST a corrective retest of the high within a broader correction or reversal lower if not a resumption of the secular bull to new highs above 132.13.
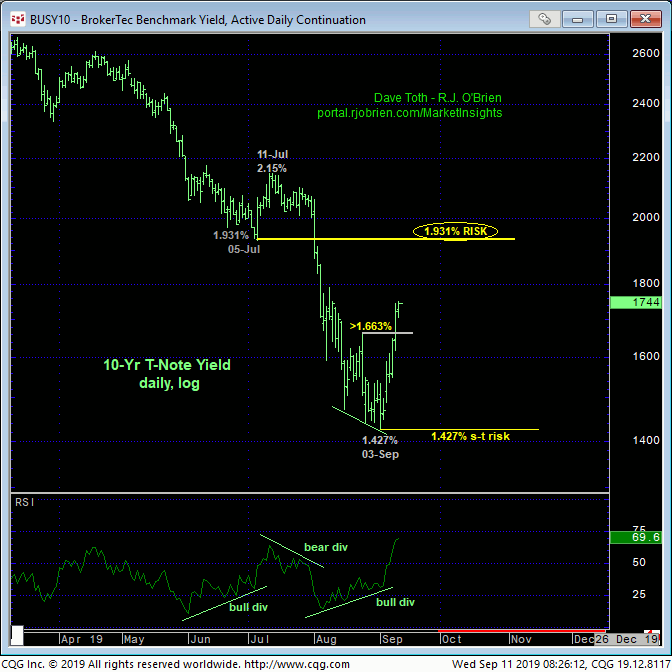
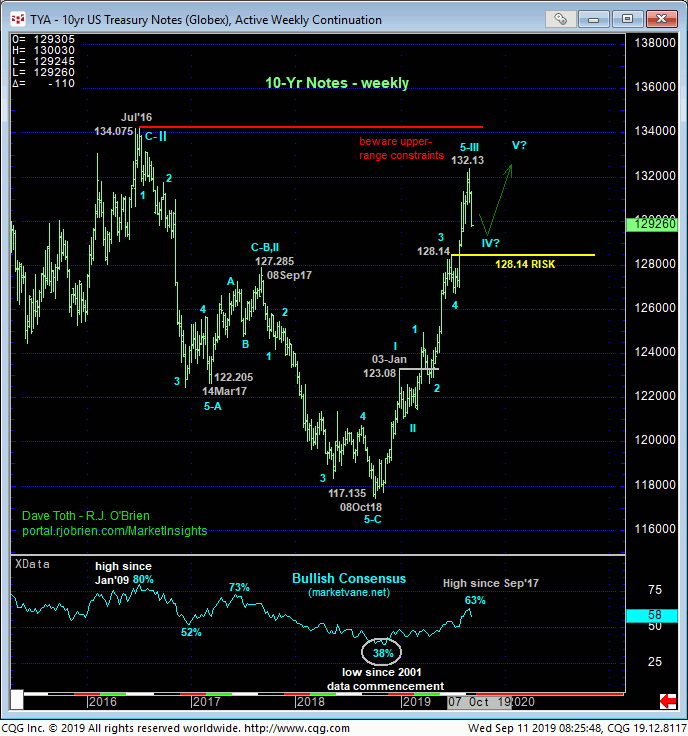
The weekly chart of the contract above and 10-yr rates below show the magnitude of the past 11-month trend and how severely they have tested Jul’16’s all-time high in price and low in yield. A slower rate in this trend is not only understandable as the market encroaches on 2016’s high in the contract (low in rates), this slower rate could easily be the start of a broader peak/reversal process (i.e. Wave-IV back down before a final 5th-Wave up). Put another way, as easy and impulsive and orderly as the past 11 months’ uptrend has been, the going is likely to get tougher in the weeks and months ahead where waning strength may see the market increasingly incapable of sustaining new highs.
In sum, the past week’s momentum failure clearly exposes the intermediate-term trend as down, but against the magnitude of the 11-month uptrend, it would be premature to conclude this relapse as anything but a (4th-Wave) correction at this juncture. A recovery above our short-term risk parameter at 132.13 will reinstate the bull and warrant a resumed, if more conservative bullish policy by shorter-term traders. Interim strength above 131.16 will arrest the correction and leave a rejected/defined low and support in place around which longer-term directional biases can then be objectively toggled. Commensurately larger-degree weakness below 128.14 remains required for long-term players to neutralize any remaining bullish exposure to circumvent the depths unknown of a broader correction or reversal lower. We will be watchful for a bullish divergence in short-term mo in the days ahead to stem this relapse and expose at east a corrective rebuttal to the past week’s slide if not a resumption of the secular bull. Either count will offer a favorable risk/reward proposition from the bull side for shorter-term traders who ave been advised to move to a neutral/sideline policy following last week’s failure below 131.13.
DEC BUNDS
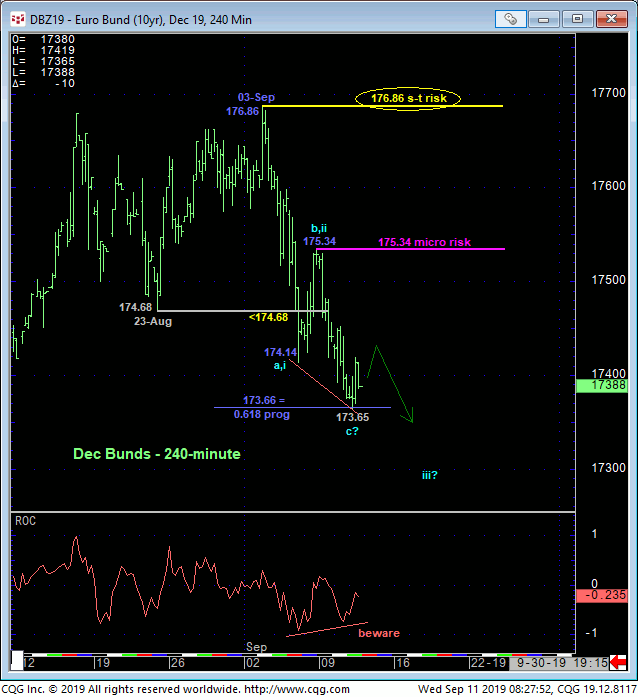
The technical construct and expectations for the German bund market are virtually identical to those detailed above in U.S. T-notes. 05-Sep’s bearish divergence in momentum defines 03-Sep’s 176.86 high as one of developing importance and our shorter-term risk parameter from which non-bullish decisions like long-covers and cautious bearish punts can be objectively based and managed. Fri’s 175.34 minor corrective high serves as a micro risk parameter the market is required to recoup to arrest the sell-off from 176.86 and expose at least a corrective rebound if not a resumption of the secular bull. Per such a micro risk parameter, it’s interesting to note that the resumed slide from that 175.34 high has stalled at the exact 0.618 progression of the 176.86 – 174.14 slide that preceded it, suggesting the possibility of a complete 3-wave and thus corrective event consistently with the still-arguable secular bull.
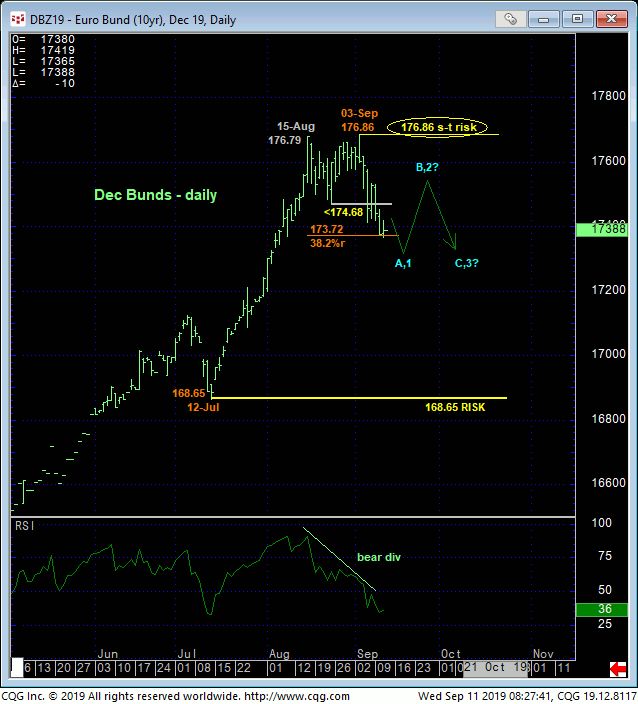
The bearish divergence in momentum is clear in the daily chart above, but here too, against the magnitude of the massive and impulsive uptrend from 08Mar18’s 156.22 low shown in the weekly chart below, it’s easy to see that the past week’s setback is grossly insufficient to be approached as anything but a corrective buying opportunity at this juncture. Commensurately larger-degree weakness below at least 12-Jul’s 171.25 larger-degree corrective low in the then-prompt Sep contract remains minimally required to break the secular uptrend.
If this is the case, traders are advised to keep their eyes peeled for a relapse-countering bullish divergence in short-term mo that would expose at least a (B or 2nd-Wave) corrective rebuttal of the recent slide if not a resumption of the secular bull and a favorable risk/reward buying opportunity.
In sum, shorter-term traders have been advised to move to a neutral/sideline position to circumvent the depths unknown of a correction or reversal lower. Longer-term players have been advised to pare bullish exposure to more conservative levels and to jettison the position altogether on a failure below 171.25. We will be watchful for a bullish divergence in short-term mo in the days/week ahead needed to stem this slide and present what we believe will be a favorable risk/reward buying opportunity for at least a more extensive retest of last week’s 176.86 high if not a resumption of the secular bull. Until such a mo failure and/or a recovery above 175.34, further lateral-to-lower prices should not surprise.
