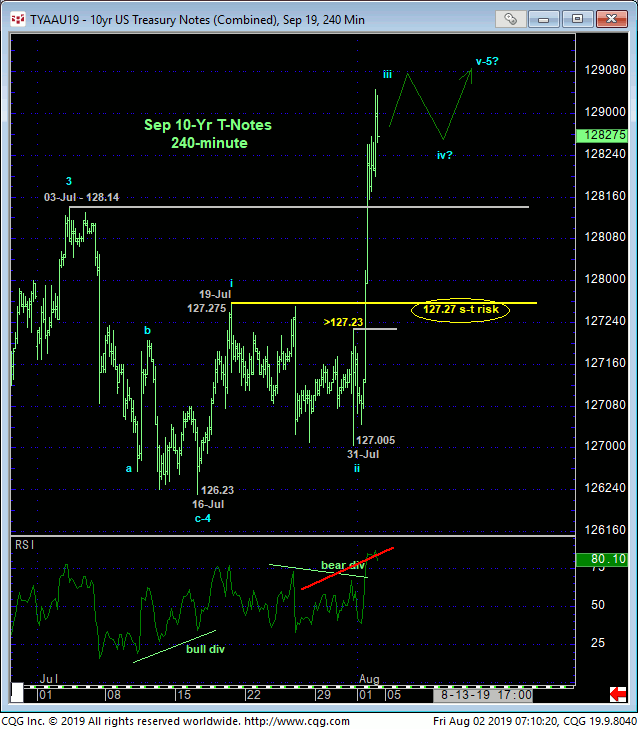
Yesterday’s impulsive spike, first above our short-term risk parameter at 127.23 and secondly above 03-Jul’s 128.14 high, obviously reinstates the major bull trend and chalks up early-to-mid-Jul’s sell-off attempt as a 3-wave and thus corrective event. On an intermediate-term scale, any bullish count would NOT be able to include a relapse below 19-Jul’s 127.275 (suspected minor 1st-Wave) high of the resumed sequence up from 16-Jul’s 126.23 low and end to the (suspected 4th-Wave) correction down from 03-Jul’s 128.14 high. These two levels- 127.27 and 126.23- thus serve as our new short- and longer-term risk parameters from which traders can objectively rebase and manage the risk of a still-advised bullish policy.
Former 128-1/4-to-128-1/2-area resistance would be expected to hold as new near-term support heading forward and a favorable risk/reward buying area on what would have to be first approached as a corrective dip back to this area.
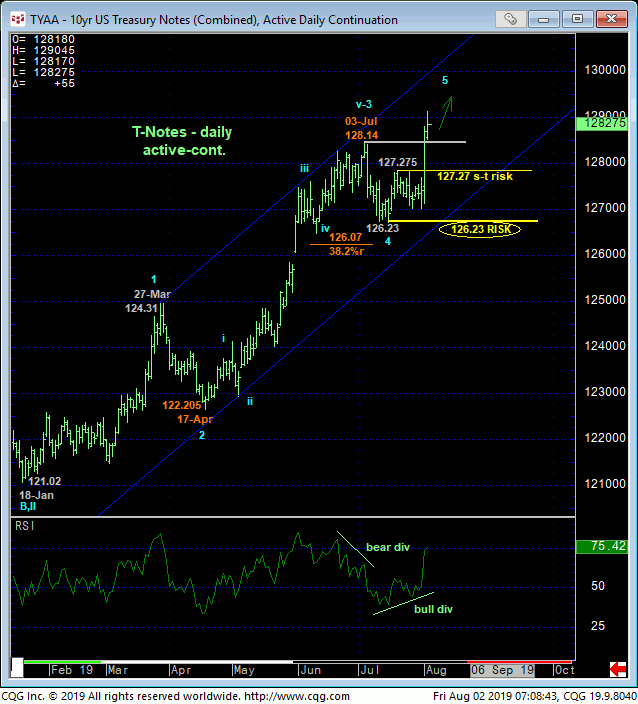
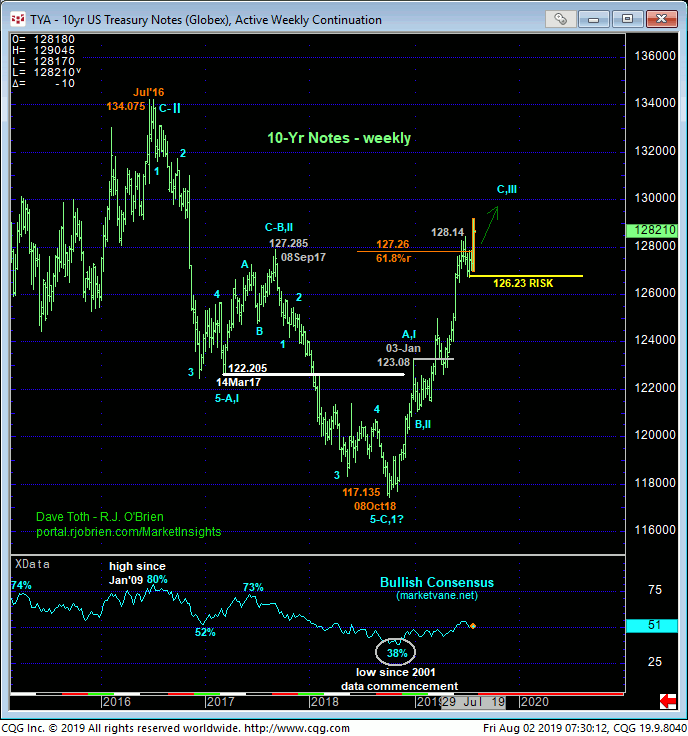
This week’s resumption of the major bull trend is obvious in the weekly active-continuation chart below. This chart shows this resumed bull entering a space totally devoid of any technical levels of merit shy of Jul’16’s 134.075 all-time high. This does not mean we’re forecasting a move to 134. But it certainly does mean that until and unless this market fails below the only pertinent technical levels like former resistance-turned-support like 127.27 or a prior corrective low like 126.23, the market’s upside potential is indeterminable and potentially severe, including a run at 134.
Remember, this T-note technical condition has been and remains virtually identical to that of the German bund market from early this year before it exploded higher to obliterate its Jun 2016 previous all-time high at 168.86 after a clear 3-wave and thus corrective sell-off from 2016 to 2018. Looking at the weekly chart of T-notes below, its 2016-18 sell-off looks to be the same sort of textbook 3-wave affair. Now we’re not going to “rely” on Elliott “theory” to conclude a move to 134+. But until and unless this market provides even minimal evidence needed to threaten such a bullish count- like fail below 126.23- there is no technical reason to believe we know how high “high” is. The Fed is not running this thing. Never has. The overall world market- formerly known back in the ’80s as the Bond Vigilantes- is.
In sum, a full and aggressive bullish policy and exposure remain advised for long-term players with a failure below 126.23 required to negate this count and warrant its cover. Shorter-term traders whipsawed out of bullish exposure following earlier this week’s minor mo failure are advised to re-establish bullish exposure on a setback to the 128.16-area OB with a failure below 127.27 required to negate this specific count and warrant its cover. In lieu of at least such sub-127.27 weakness, further and possibly steep, even relentless gains are once again exposed.
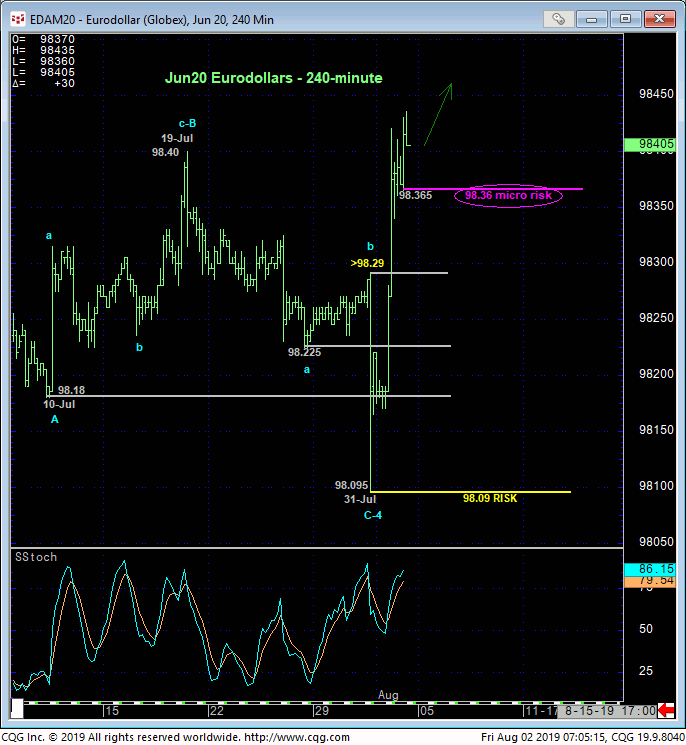
While the market hasn’t broken 25-Jun’s 98.50 high yet, the extent and impulsiveness of yesterday’s sharp rebound renders the sell-off attempt from that high to Wed’s 98.095 low a clear 3-wave affair as labeled in the daily chart below. Left unaltered by a relapse below 98.095, this 3-wave decline is considered a corrective/consolidative event that warns of a resumption of the major uptrend that preceded to eventual new highs above 98.50. In this regard we are identifying 98.09 as our new key long-term risk parameter to a still-advised bullish policy for long-term players.
The market’s position just beneath the past month’s resistance maintains the prospect then for further intra-range chop. Given the uninterrupted and steep nature of yesterday’s rebound, the only reasonable minor corrective low we can identify as a risk parameter is an extraordinarily tight, micro level at 98.365 detailed in the 240-min chart below. Of course, such a tight risk parameter comes at the expense of whipsaw risk, so bull traders can pick between 98.36 and/or 98.09 to protect their bullish exposure. That’s just the nature of the beast at the moment, so acknowledgement of and adherence to technical and trading SCALE is paramount under these conditions.
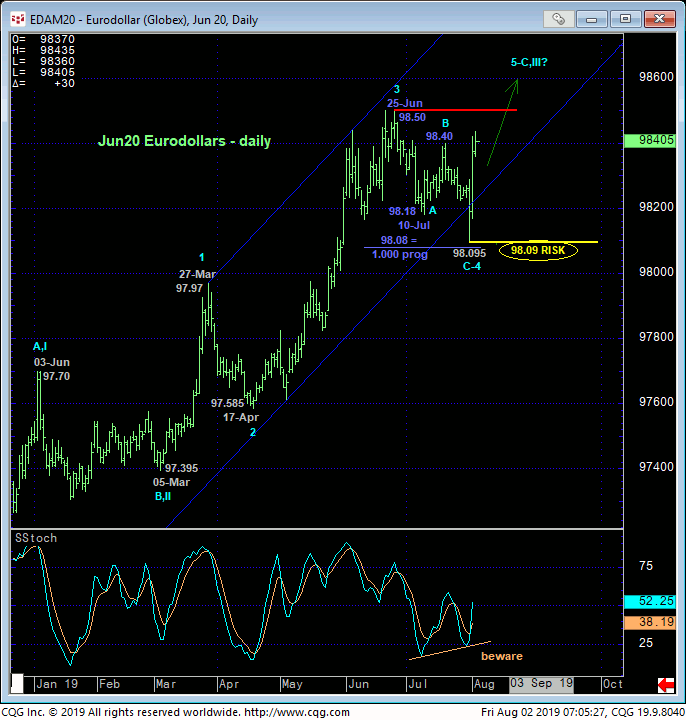
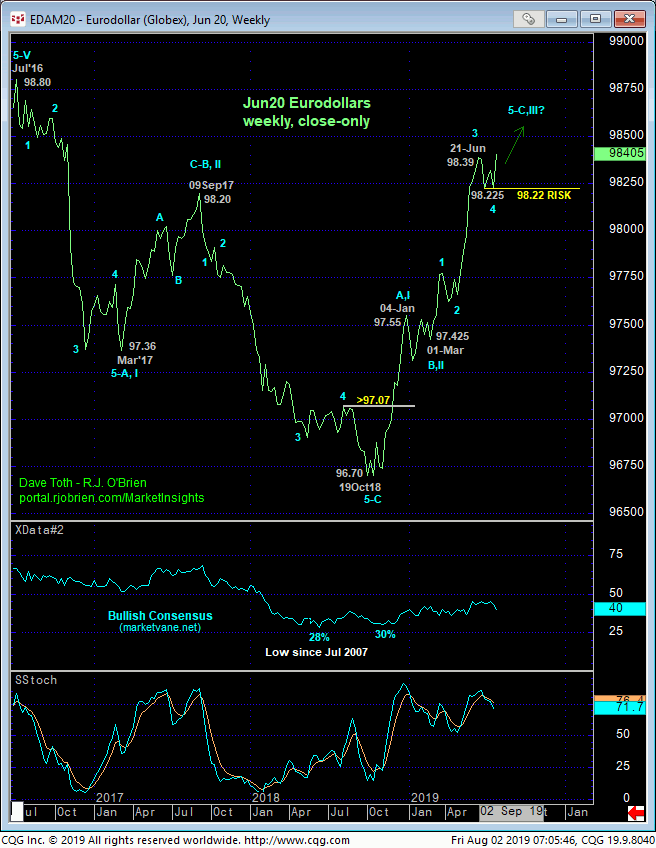
From a long-term perspective shown in the weekly close-only chart below, the market has yet to provide the evidence needed to threaten a bullish count. Minimally, a weekly close below 98.22 or and intra-week failure below 98.09 is now required to confirm weakness/vulnerability on a scale sufficient to threaten the major bull. Until and unless such weakness is shown, further and possibly accelerated gains should not surprise.
These issues considered, a bullish policy and exposure remain advised for long-term players with a failure below 98.09 required to negate this call and warrant its cover. Shorter-term traders whipsawed out of exposure following this week’s earlier bearish divergence in mo are advised to first approach a setback to the 98.30-area OB as a corrective buying opportunity with a failure below 98.09 required to negate this call and warrant its cover.
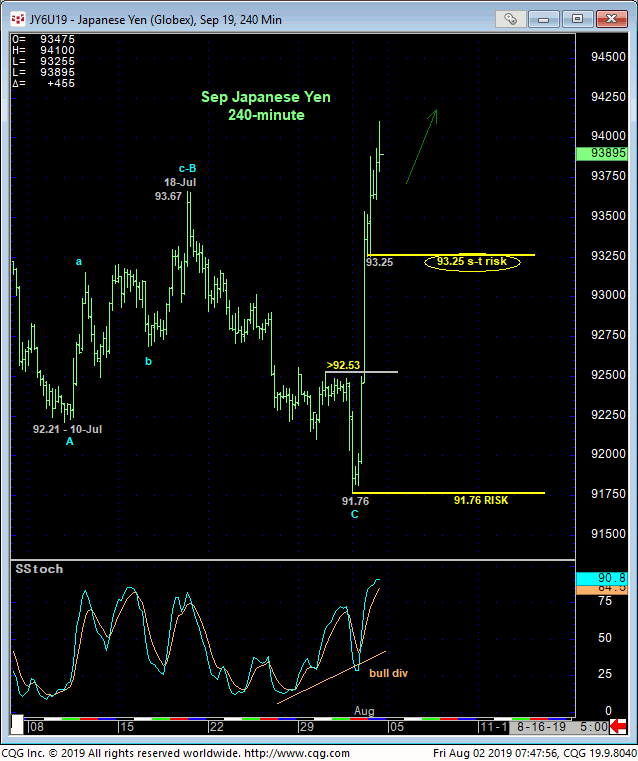
The market’s recovery above our short-term risk parameter at 92.53 yesterday morning confirmed the bullish divergence in short-term momentum stemmed the recent slide from 18-Jul’s 93.67 high. This mo failure preempted the subsequent explosive rally that, like the T-note and Eurodollar markets, rendered the entire sell-off from 25-Jun’s 94.22 high to yesterday’s 91.76 low a 3-wave and thus corrective affair that resurrects Apr-Jun’s broader uptrend that preceded it.
Today’s continuation of this recovery leaves today’s 93.25 low in its wake as the latest smaller-degree corrective low and tightest risk parameter this market is now required to fail below to defer the bull and expose another intra-range setback. Until and unless at least such sub-93.25 weakness is shown, a continued rally to new highs above 94.22 should not surprise.
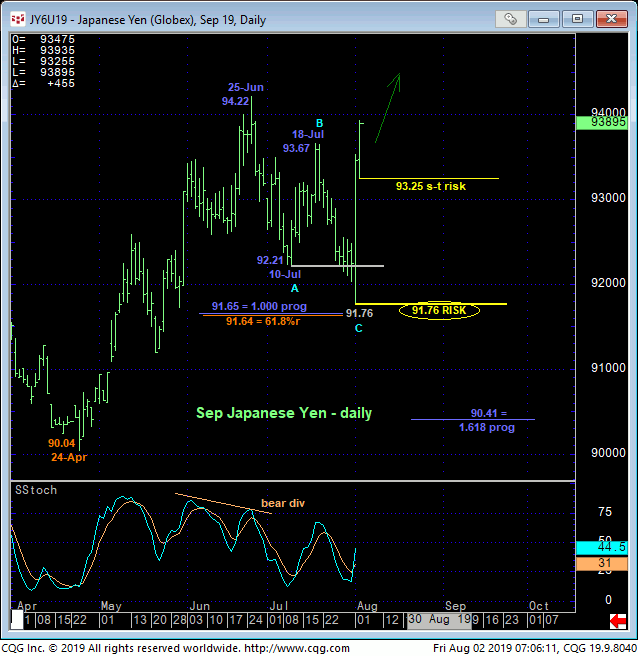
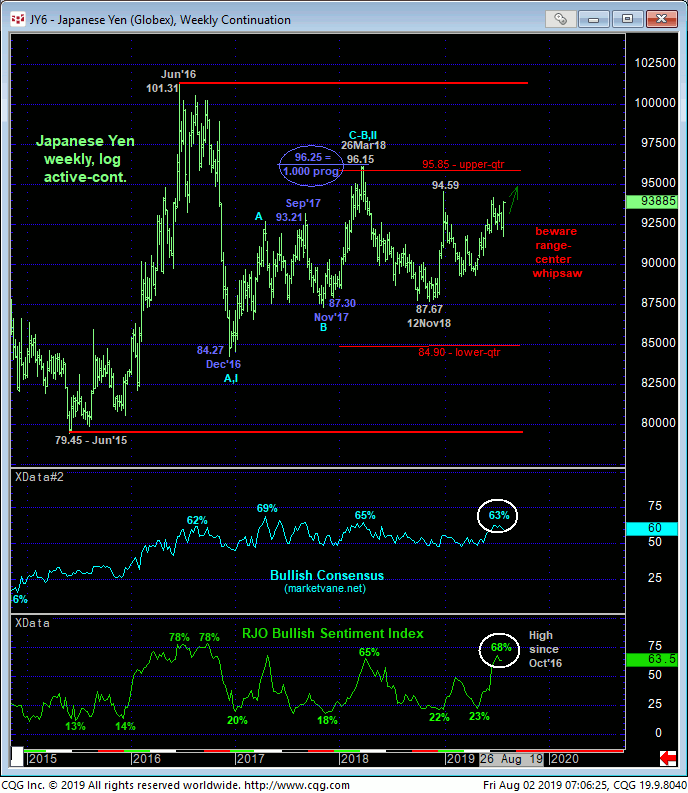
If there’s a difference between the U.S. interest markets and the yen, its that the yen remains trapped deep within in the middle-half bowels of an incessant, multi-year lateral range shown in the weekly log chart below. With market sentiment/contrary opinion indicators at historically high levels, we are not confident that this intra-range bull will be able to sustain itself. But as a result of yesterday’s events, we 1) anticipate at least one more round of new highs above 94.22 and 2) have an outstanding low, support and risk parameter at 91.76 that we can objectively gauge a major momentum failure that, combined with frothy sentiment , will resurrect a major peak/reversal environment.
In sum, traders have been advised to neutralize recent bearish policy and exposure. But while we anticipate further gains, the market’s current position just beneath 25-Jun’s 94.22 high and resistance presents poor risk/reward merits for bullish exposure “up here”. Per such, a neutral/sideline policy is advised for the time being.
