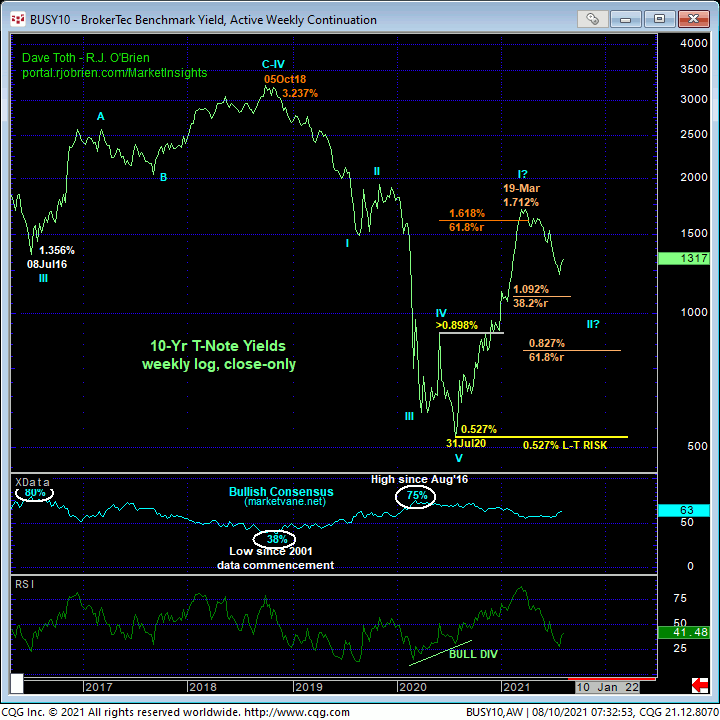
Last Wed’s initial failure below our 134.25 mini risk parameter followed by yesterday’s subsequent failure below 22-Jul’s 133.27 corrective low and our short-term risk parameter discussed in last Wed’s Technical Blog confirms a bearish divergence in daily momentum that defines 04-Aug’s 135.14 high as one of developing importance and our new short-term risk parameter from which shorter-term traders with tighter risk profiles can objectively base non-bullish decisions like long-covers and cautious bearish punts. Given the magnitude of a FOUR MONTH recovery however, it would be premature to conclude this setback as anything more than a slightly larger-degree correction within this still-developing uptrend at this juncture. Moreover, even if the trendy impulsiveness of this setback is just the initial (A- or 1st-wave of an even larger-degree correction lower or a more protracted reversal, we would anticipate a corrective rebuttal higher to this slide and another bearish divergence in short-term momentum needed to stem such a rebound for a preferred risk/reward opportunity from the bear side.
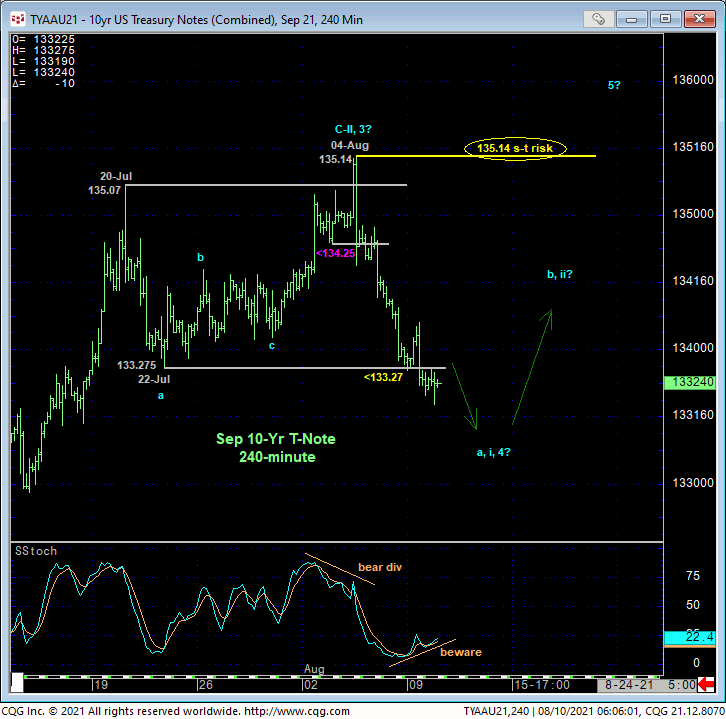
The daily close-only chart of the contract above shows the bearish divergence in momentum that clearly rejects/defines 02-Aug’s 135.00 high close as one of developing importance. But again, against the backdrop of a four month uptrend, it is equally clear that we cannot conclude a major high and resistance from proof of just short-term weakness. Indeed, this setback is easily construed as just a (4th-Wave) correction within the broader and impressive uptrend.
At this point and in lieu of a failure below 15-Apr’s 131.27 (prospective 1st-Wave) high needed to jeopardize the impulsive integrity of a broader bullish count, a significant amount of peak/reversal threat behavior is needed to threaten the four month rally enough to warrant considering a longer-term bearish policy. Such evidence would come in the form of labored, 3-wave corrective behavior on recovery attempts and subsequent relapses below prior initial counter-trend lows.
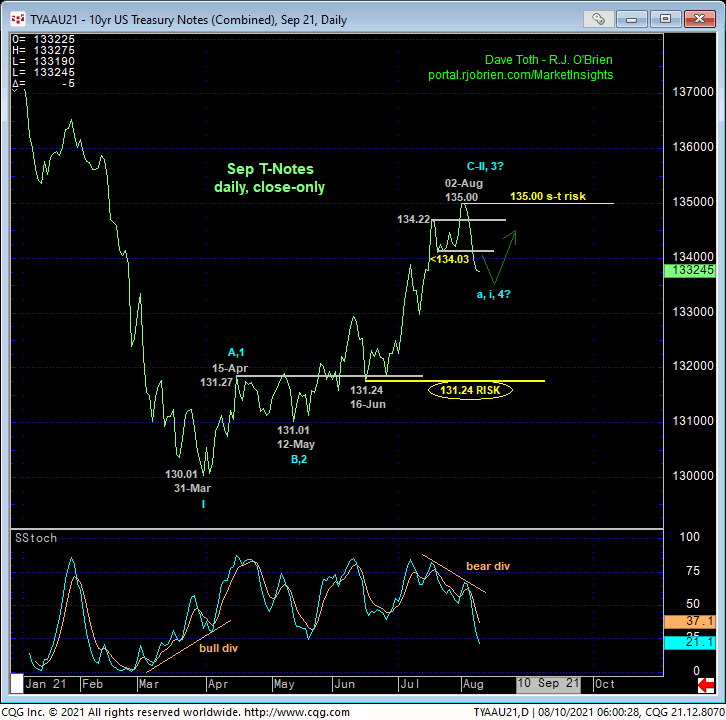
Looking at the similar but inverted daily log close-only chart of 10-yr yields below that shows a bullish divergence in momentum that has interrupted the broader downtrend, the rebound thus far has failed to reach even a Fibonacci minimum 38.2% retrace of May-Aug’s (prospective 3rd-Wave) decline from 1.695% to 1.176%. This rebound thus far falls easily within the bounds of a mere (4th-wave) correction within the broader downtrend in rates.
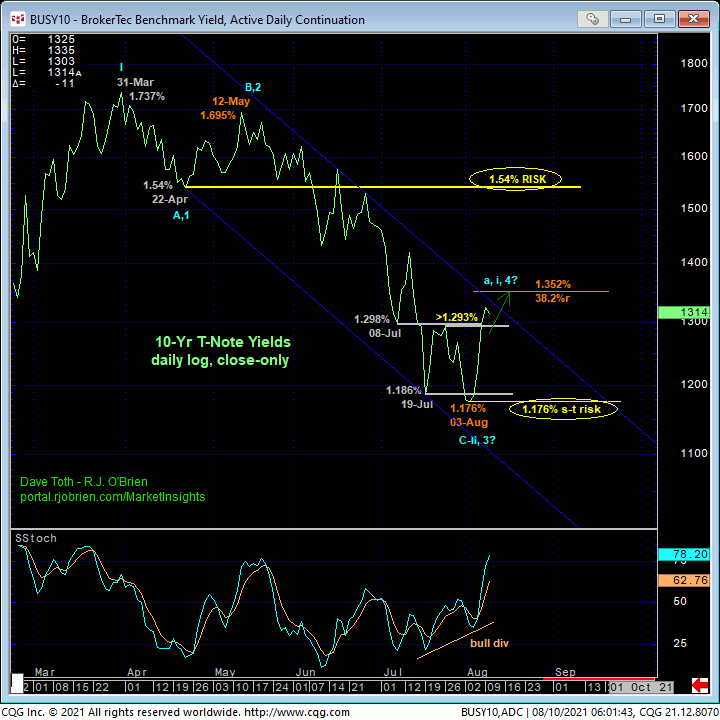
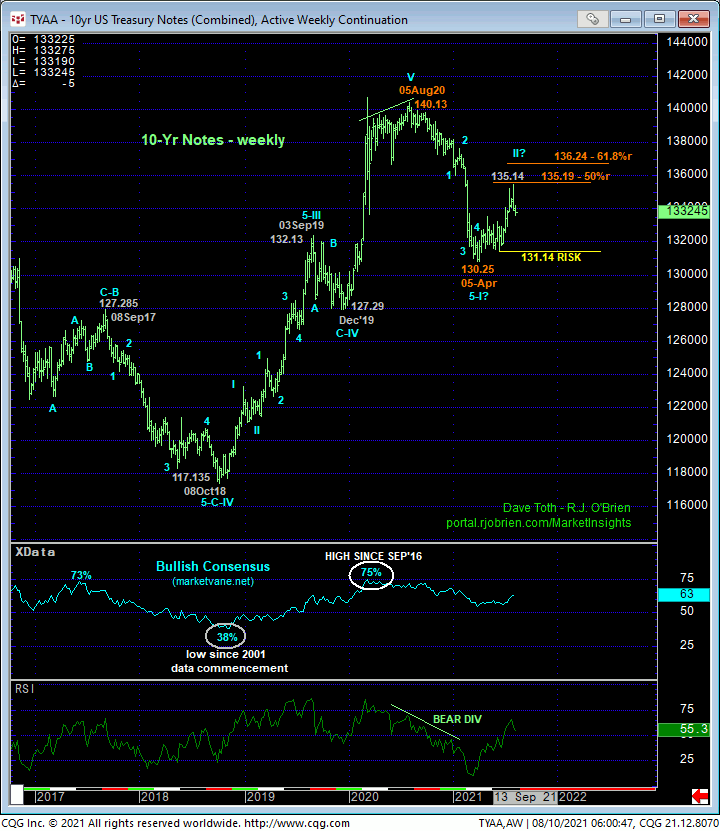
On an even larger scale and while nothing to sneeze at, the four month recovery in the contract and relapse in rates is a sort of “tweener”. It’s too big to be a 4th-wave (of a 5-wave sequence down from Aug’20’s 140.13 high (up from Jul’20’s 0.527% low) but arguably too small to be a 2nd-wave correction of the entire Aug’20 – Apr’21 move. Granted, on a weekly active-continuation chart of the contract above, the rebound came within a few ticks of the (135.19) 50% retracement of the 2020 – 2021 decline from 140.13 to 130.25. But as discussed in last week’s update, if Aug’20 – Apr’21’s decline is the 1st-wave of a massive reversal of a secular bull market that has spanned 39 YEARS where the long-term bull forces are likely to require a multi-quarter or even multi-year reversal process, a more extensive (i.e. 61.8% retrace or more) 2nd-wave correction would be expected.
Indeed, on a weekly log close-only chart of 10-yr yields below, this prospective 2nd-Wave corrective relapse has yet to retrace even a Fibonacci minimum 38.2% of Jul’20 – Mar’21’s 0.527% – 1.712% rate rise. On this basis, it’d be easy to envision further (major 2nd-Wave) corrective erosion that could span months or even quarters ahead and a more protracted 61.8% retracement to the 0.827%-area.
In effect, the short-term trend is down within the longer-term trend that remains arguably up. And while the bearish divergence in daily momentum has certainly interrupted the four month rally, it would be premature to conclude the setback as anything more than a slightly larger-degree correction within the still-developing recovery at this time. This momentum failure has nonetheless rejected/defined 04-Aug’s 135.14 high as one of developing importance and an objective risk parameter from which non-bullish decisions like long-covers can be objectively based and managed by shorter-term traders with tighter risk profiles. And given the impracticality of a larger-degree bull risk parameter down around the 131-3/4-area from a long-term perspective, even longer-term institutional players have the option of paring bullish exposure to more conservative levels and exchanging whipsaw risk (above 135.14) for deeper nominal risk below 131-3/4. We will be watchful for proof of labored, 3-wave corrective behavior on a recovery attempt to the past week’s slide for a favorable risk/reward opportunity from the bear side. Needless to say, a recovery above 135.14 chalks up this setback as a correction and reaffirms the four month rally ahead of what could be protracted gains thereafter.
