
Posted on Jan 17, 2023, 09:13 by Dave Toth
MAR 10-Yr T-NOTES
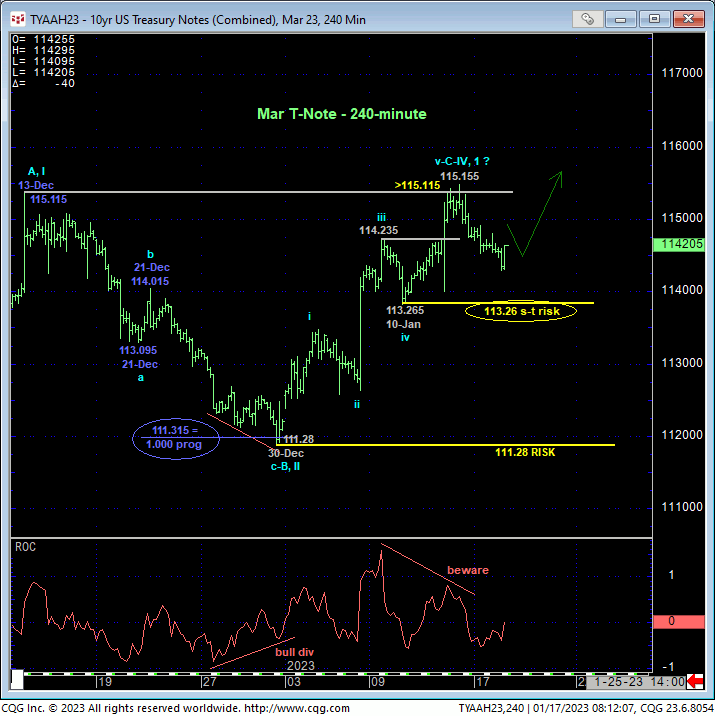
In last Thur’s Technical Blog we discussed the pivotal nature of 13-Dec’s 115.115 high, the break of which would confirm Dec’s setback from 115.115 to 111.28 a 3-wave and thus corrective event and resurrect a base/correction/reversal threat from 21-Oct’s 108.265 low that could be major in scope. After taking out that key 115.115 high on Fri following the latest report on the nation’s CPI however, the 240-min chart below shows the market’s lack of follow-through higher and subsequent flagging price action. As a result of Fri’s continuation of this month’s uptrend however, this short-term chart also shows the market’s definition of 10-Jan’s 113.26 low as the level the market is now required to fail below to complete a 5-wave sequence up from 30-Dec’s 111.28 larger-degree corrective low. Per such, 113.26 and 111.28 serve as our new short- and longer-term risk parameters from which traders can objectively base non-bearish decisions like short-covers and bullish punts commensurate with their personal risk profiles.
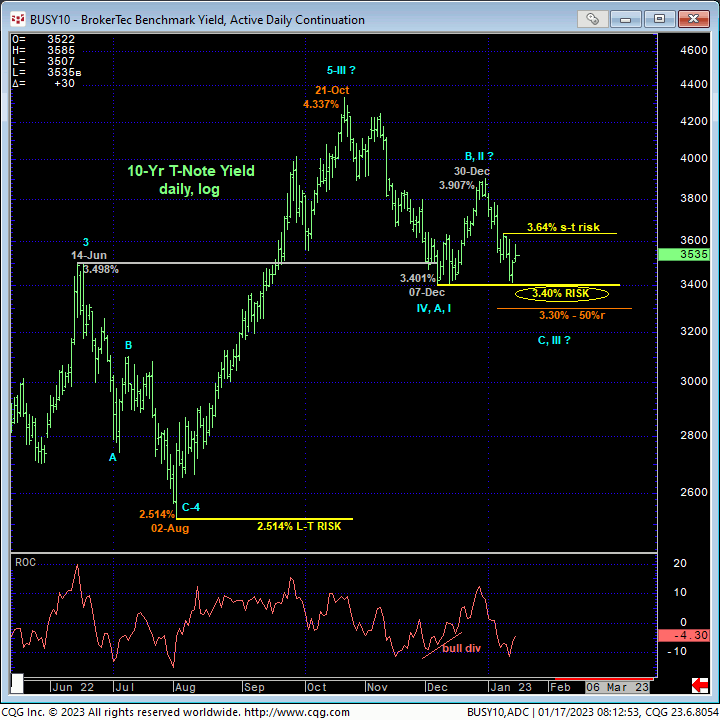
While the contract has yet to fail on even a shorter-term basis needed to question a bullish count, what merits attention to Fri and today’s relatively flagging price action is the fact that this market has yet to break 07-Dec’s key 3.401% low on a yield basis shown in the daily log chart below. This is the analogous rate level and key risk parameter to 13-Dec’s 115.115 high in the contract. There’s no doubt that the nearly-three-month erosion in rates looks “heavy” and warns of further losses ahead. But stranger things have happened, and we would not conclude the resumption of the 3-month drop in rates until/unless this market breaks below 3.40%. This said, 10-Jan’s 3.64% minor corrective high serves as the short-term risk parameter analogous to that day’s 113.26 minor corrective low and bull risk parameter in the contract. In effect, 3.64% and 3.40% serve as the key short- and longer-term risk parameters around which to toggle directional biases and exposure on a yield basis.
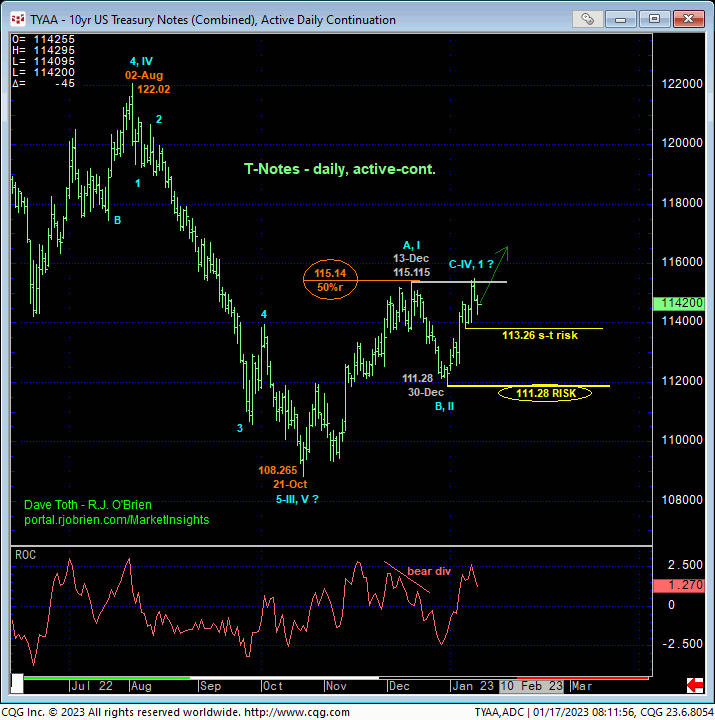
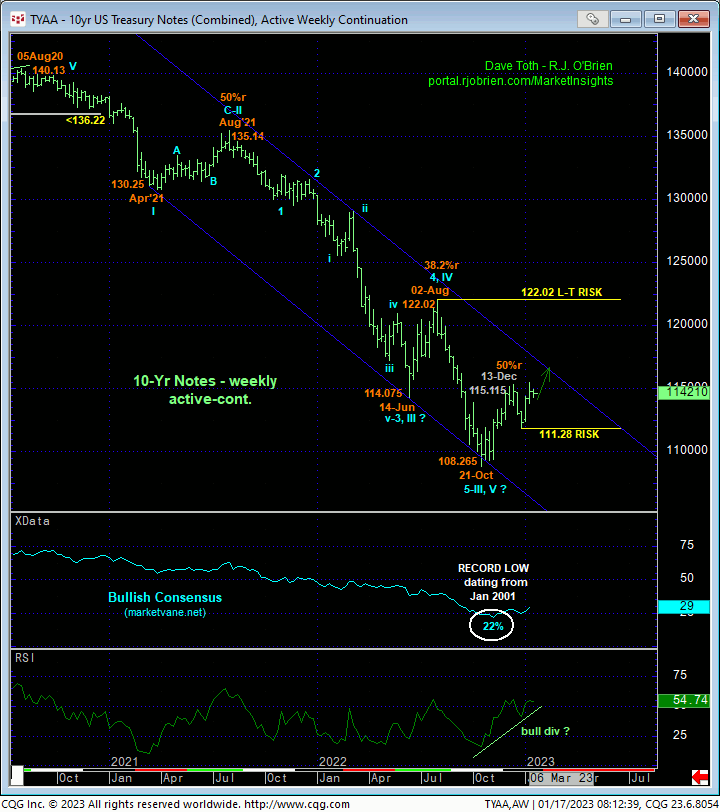
On a much broader scale and despite the discrepancy of the contract taking our 13-Dec’s 115.115 high while the key yield low at 3.40% remains intact, the market has yet to provide the evidence necessary to question the major base/correction/reversal count we introduced in 10Nov22’s Technical Webcast. The technical elements on which such a count is predicated include:
- a confirmed bullish divergence in weekly momentum amidst
- the lowest (22%) level in the Bullish Consensus (marketvane.net) ever recorded (dating from Jan 2001 inception), and
- a prospectively complete and massive 5-wave Elliott sequence down from Aug’20’s 140.13 high as labeled below.
Given the long-term nature of the 26-MONTH decline from 202’s 140.13 high to 21Oct22’s 108.265, it could easily be months or even quarters before it’ll become apparent whether that 106.265 low completed 5-waves down from 140.13 or only three. But even in the event of a major 4th-Wave correction of what would be a 3rd-Wave down from Aug’21’s 135.14 high to Oct’s 108.265 low, the market’s upside potential could be substantial and should not be underestimated.
These issues considered, traders have been advised to move to or continue a bullish policy and exposure with a failure below 113.26 required for shorter-term traders to stand aside and commensurately larger-degree weakness below 111.28 for longer-term institutional players to follow suit. In lieu of such weakness and especially on resumed strength above Fri’s 115.155 high, further and possibly protracted gains should not surprise.
DEC23 SOFR
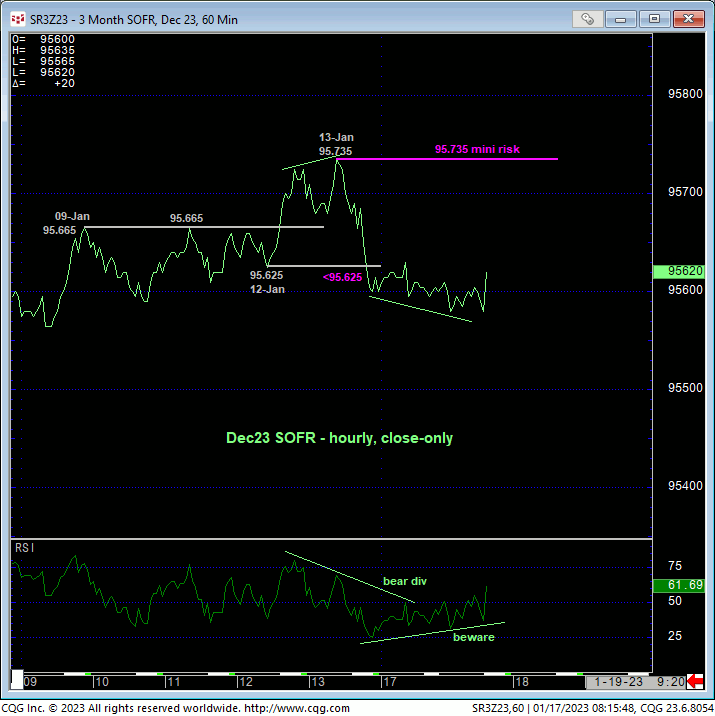
Contributing the at least short-term concern over flagging prices in the 10-yr contract is the Dec23 SOFR contract’s failure to sustain Fri’s gains above an hourly close-only corrective low and mini bull risk parameter at 95.625 as detailed below. The market’s failure to sustain gains above former 95.66-area resistance-turned-support and ultimately below 12-Jan’s 95.625 (admittedly) minor corrective low- especially following Fri’s CPI report- confirms a bearish divergence in short-term momentum. We cannot conclude broader weakness from such a smaller-degree mo failure, but it does highlight the importance of the past couple months’ lateral range and its boundaries at 95.33 and 95.84 discussed below.
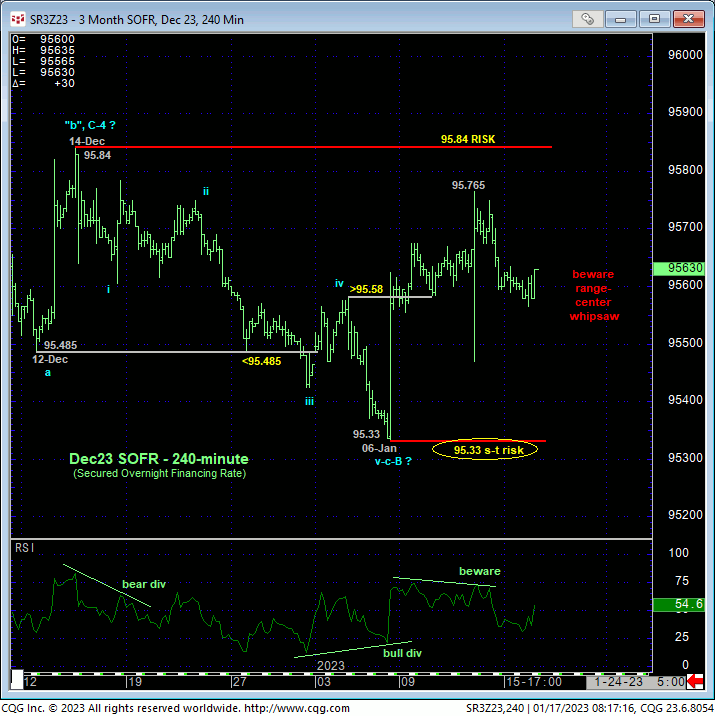
The 240-min chart above and daily chart below show the key 95.84 and 95.33 boundaries to the past couple months’ range where it remains debatable whether Nov-Dec’s recovery is a complete 3-wave correction ahead of a resumption of the secular bear trend that preceded it OR if a larger-degree correction or reversal higher is still in its early stages. To bet on the inevitable breakout from this range from its middle-half bowels is a poor risk/reward coin flip, so traders are urged to acknowledge and put a plan in place for either outcome. A break above 95.84 will reinforce the broader base/correction/reversal count while a relapse below 95.33 will tilt lnger0-term directional scales back towards to secular bear. Whilst in the middle of this range, aimless whipsaw risk is expected.

From a very long-term perspective and as with the T-Note market, the combination of:
- a confirmed bullish divergence in weekly momentum amidst
- historically bearish levels in the Bullish Consensus (marketvane.net), and
- an arguably complete and massive 5-wave Elliott sequence down from Aug’20’s 99.985 high
is unique and compelling and, if correct, warns of potentially protracted gains above 95.84 that could span months or even quarters.
These issues considered, a neutral/sideline policy is advised for the time being from the middle of the past month’s range with a recovery above 95.84 warranting a move to a new bullish policy and exposure and a relapse below 95.33 required to return to a cautious bearish stance.


