Posted on Dec 21, 2023, 06:08 by Dave Toth
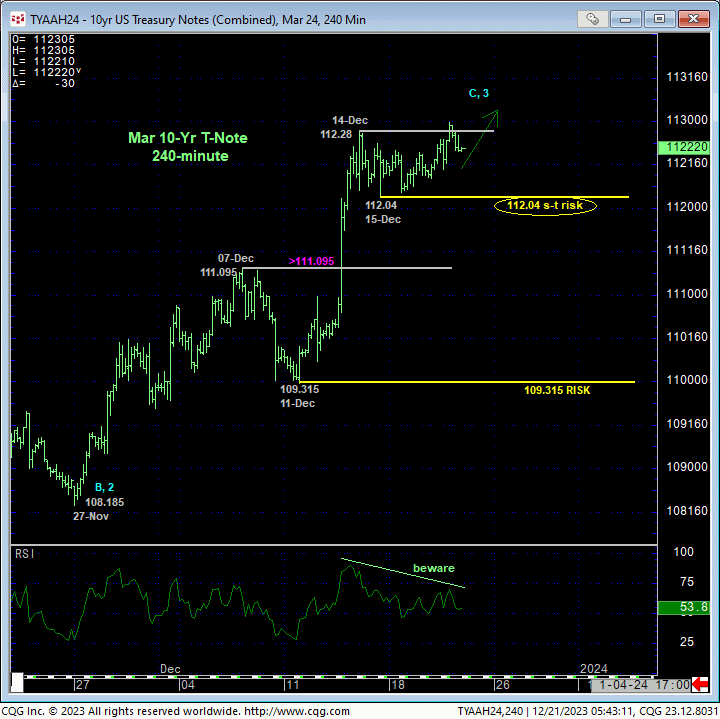
Yesterday’s late poke above last week’s 112.28 high reaffirms the now-two-month reversal from 19-Oct’s 105.105 low and leaves a new pair of smaller- and larger-degree corrective lows in its wake at 112.04 and 109.315 this market is now expected to sustain gains above to maintain a more immediate bullish count. Its failure to stay above 112.04 will confirm a bearish divergence in short-term momentum and break the uptrend from at least 11-Dec’s 109.315 low, exposing a more protracted correction lower. Per such, we’re identifying 112.04 as our new short-term parameter from which shorter-term traders with tighter risk profiles can objectively rebase and manage the risk of a still-advised bullish policy and exposure.
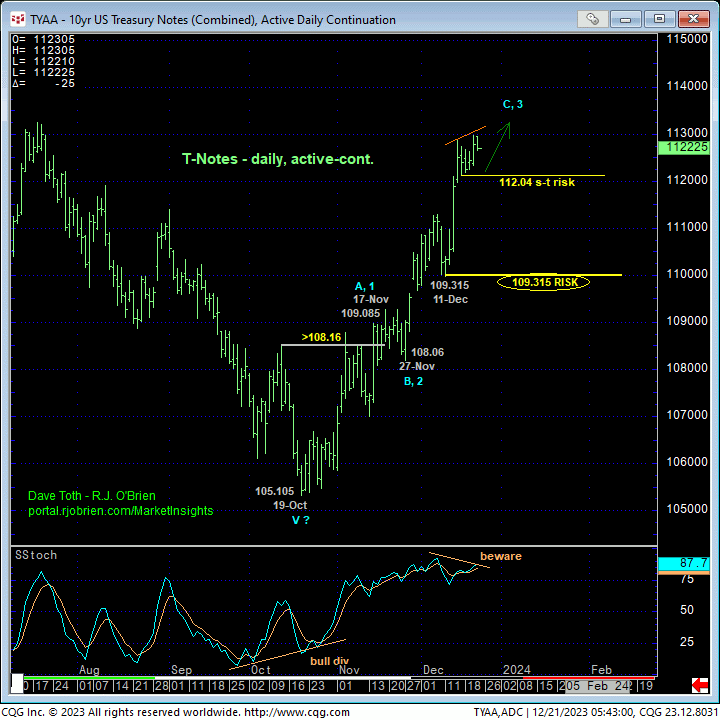
On the next larger scale, the daily chart below shows the developing potential for a bearish divergence in daily momentum, but commensurately larger-degree weakness below 11-Dec’s 109.315 larger-degree corrective low is now required to CONFIRM this divergence to the point of non-bullish action like long-covers by longer-term institutional players. Per such, this 109.315 low serves as our new long-term bull risk parameter.
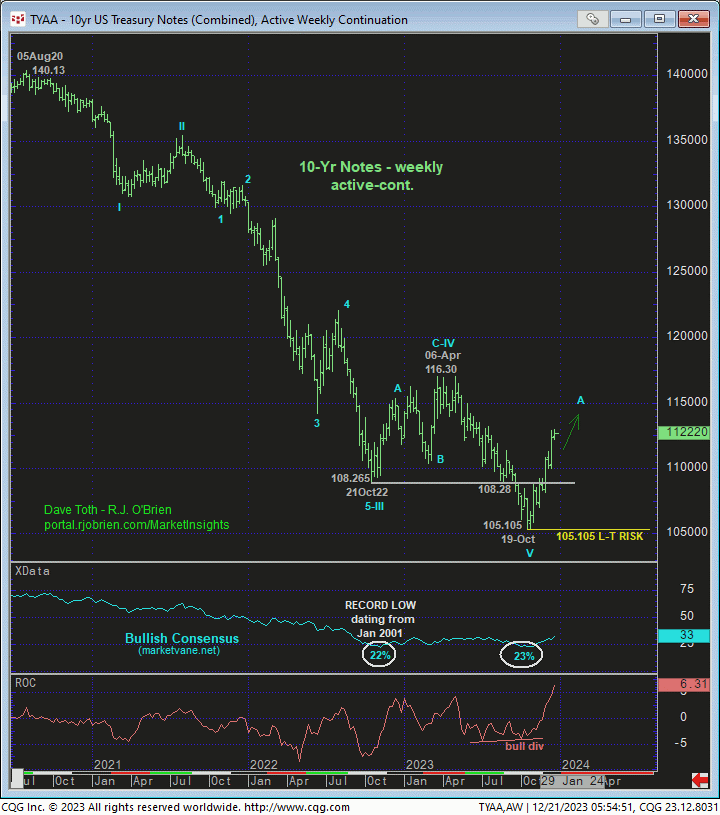
Moving out even further, the weekly chart of the contract below show the key elements on which our major base/reversal count is predicated:
• a confirmed bullish divergence in weekly momentum
• the market’s gross failure to sustain Sep/Oct’s break below Oct’22’s key low and support around 108-3/4 that rendered it a new key resistance candidate
• historically bearish sentiment/contrary opinion levels
• an arguably complete and massive 5-wave Elliott sequence down from Aug’20’s 140.13 all-time high.
Until/unless nullified by a relapse below 19-Oct’s 105.105 low, these elements warn that that 105.105 low is THE END of the secular 38-MONTH downtrend in contract prices ahead of a correction higher that could easily span quarters. The challenge in the weeks/months ahead will be navigating the likely (B-Wave) corrective rebuttal to this initial (A-Wave) counter-trend rally within a multi-month or multi-quarter base/reversal PROCESS. Herein lies the importance of the corrective lows and bull risk parameters identified above at 112.04 and especially 109.315.
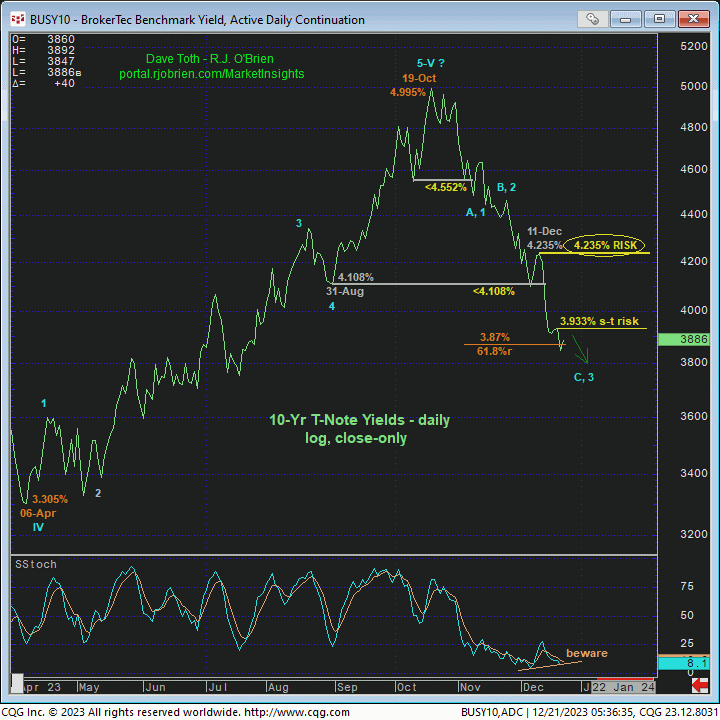
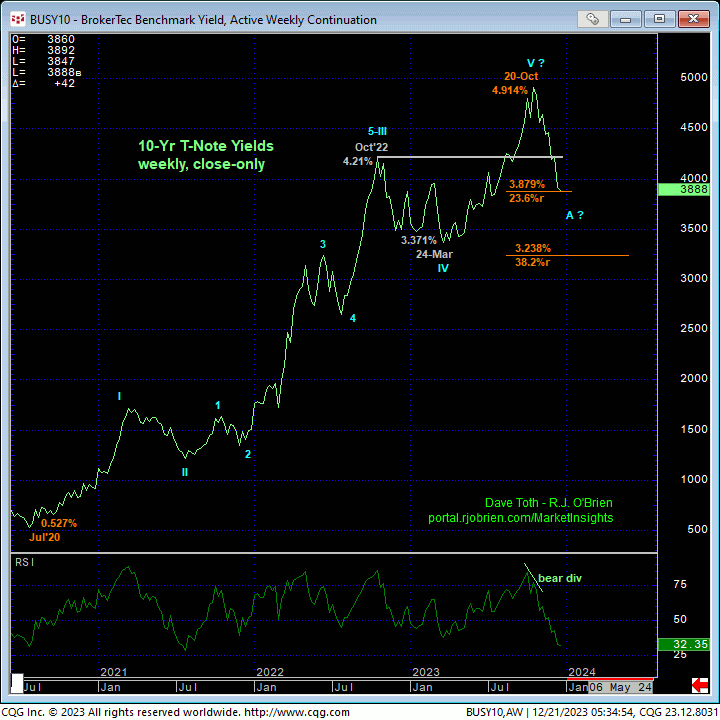
Basis 10-yr yields, the daily log close-only chart above shows the extent and impulsiveness of the past couple months’ reversal thus far. Smaller- and larger-degree corrective lows and risk parameters in the contract at 112.04 and 109.315 correlate with smaller- and larger-degree corrective highs in yield at 3.933% and 4.235% in the underlying cash 10-yr market. Until/unless yields recoup these highs, the trend in yield is clearly down and should not surprise by its continuance.
Here too, only inverted, the massive move up in yields from Jul’20’s 0.527% low weekly close to 20-Oct’s 4.914% high looks to be a textbook complete 5-wave Elliott sequence as labeled below. If correct, this count warns of a multi-month or even multi-quarter move LOWER in rates. To negate this call, 10-yr yields need to recoup 20-Oct’s 4.914% high. However, a (B-Wave) corrective rebuttal to this initial (A-Wave) counter-trend decline in rates is likely somewhere along the line in this peak/reversal process, so we want to keep a keen eye on MOMENTUM to the downside. When a bullish divergence arrests the current slide, traders should prepare for an interim rebound in rates that will likely surprise many. And for what it’s worth, this weekly chart shows the market currently engaging the (3.879%) Fibonacci minimum 23.6% retrace of the entire 39-month secular move higher in rates. An accompanying confirmed bullish divergence in momentum will reinforce this merely “derived” Fibonacci relationship and expose a rate rebound. Until/unless such a momentum failure arrests the rate slide however, further rate losses remain expected.
These issues considered, a bullish policy and exposure in the contract remain advised with a failure below 1121.04 sufficient for shorter-term traders to take defensive measures and commensurately larger-degree weakness below 109.315 for longer-term institutional players to follow suit. IN lieu of such weakness, the trend is up and should not surprise by its continuance or acceleration straight away.