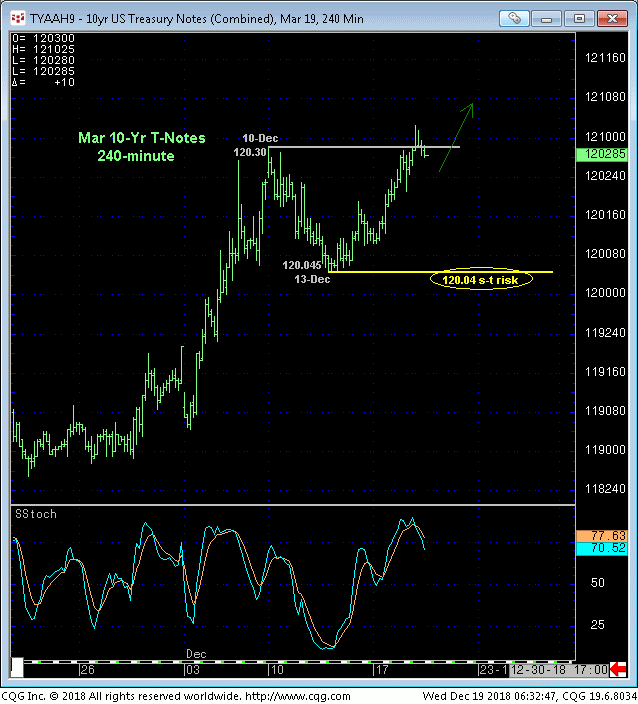
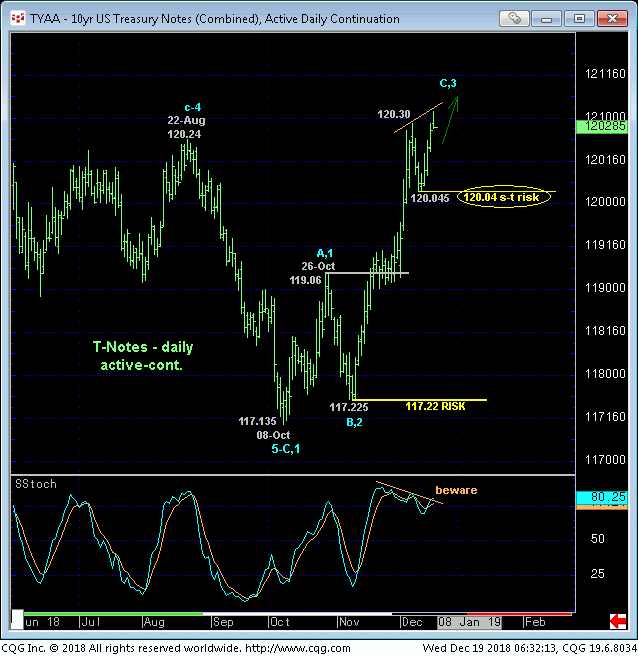
Today’s break above 10-Dec’s 120.30 high reaffirms the developing uptrend and our broader base/reversal count and leaves 13-Dec’s 120.04 low in its wake as the latest smaller-degree corrective low this market is now required to fail below to confirm a bearish divergence in momentum, stem the rally and expose at least another interim corrective setback. In lieu of such sub-120.04 weakness the trend remains up on all pertinent scales and should not surprise by its continuance or acceleration. In this regard we are identifying this 120.04 low as our new short-term risk parameter from which a bullish policy and exposure can be objectively rebased and managed.
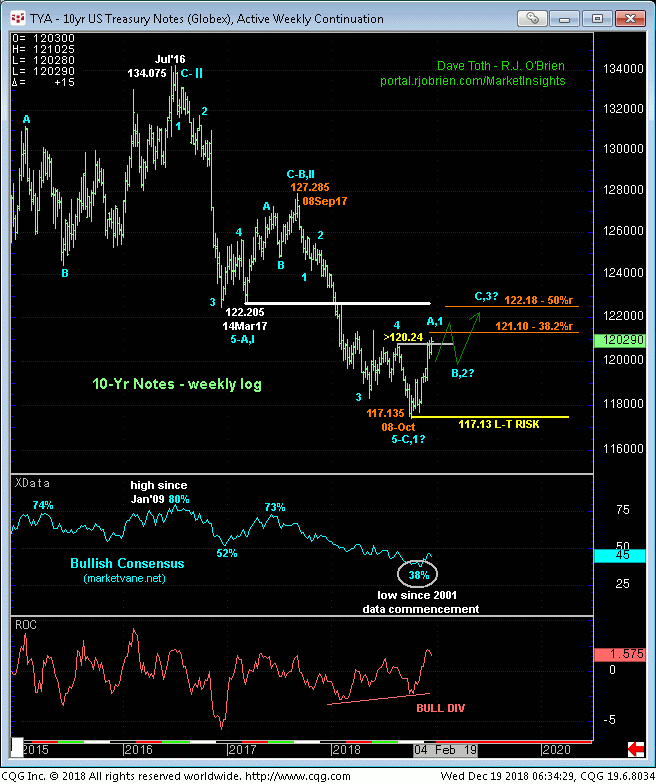
The weekly log chart of the most active contract below shows the trifecta of technical evidence of a reversal:
- a confirmed bullish divergence in momentum above 120.24 that, in fact, breaks Sep’17 – Occt’18’s downtrend amidst
- historically bearish sentiment (in fact, the lowest Bullish Consensus ever recorded at 38%) and
- a complete 5-wave Elliott sequence down from Sep’17’s 127.285 high.
These technical facts identify 08-Oct’s 117.135 low as THE END of at least the 13-month downtrend from Sep’17’s high and start of at least a correction of this portion of the secular bear trend and, at most, a major reversal higher. Mar-Sep’17’s correction from 122.20 to 127.28 may be used as a proxy for a “mere correction” that would project to the 122-1/2-area. This area is also home to the (122.18) 50% retrace of the 127.28 – 117.13-decline as well as key former support from Mar’17 that, since broken in Jan’18, serves as a new resistance candidate.
The path to “wherever” on the upside is not likely to be a straight one and could indeed include some corrective setbacks. And herein lies the importance of identifying tighter but yet objective risk parameters like 120.04 discussed above.
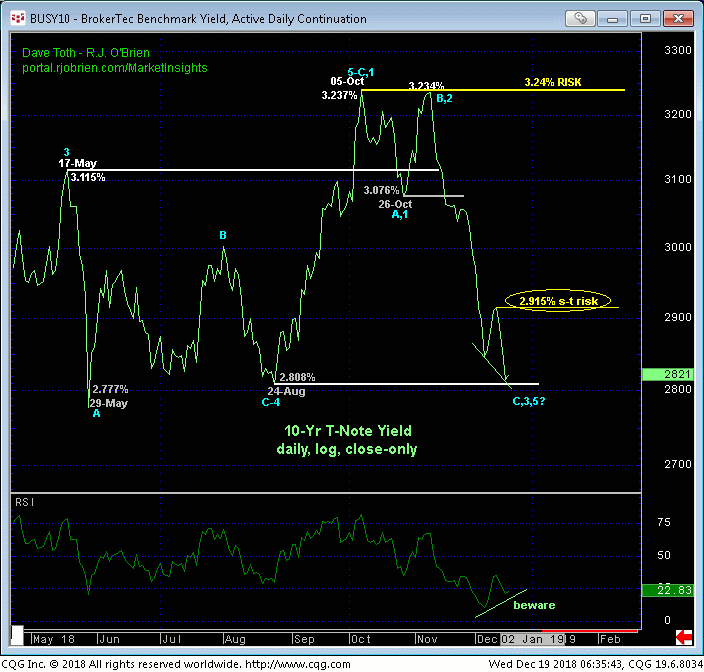
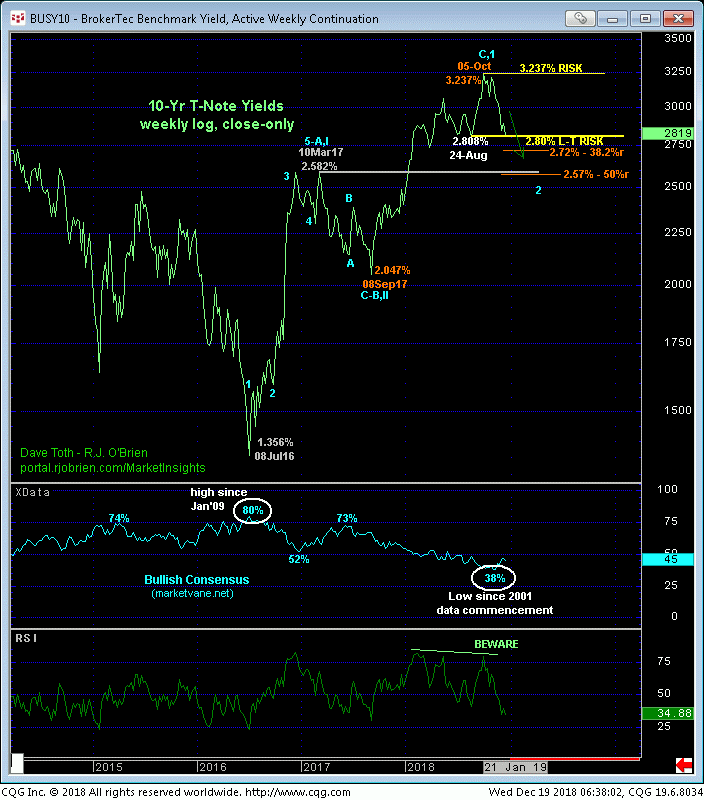
From a yield perspective, the daily (above) and weekly (below) log scale close-only charts show that the market has yet to actually break 24-Aug’s 2.808% low to, in fact, break the major uptrend in rates. But given the extent and impulsiveness of the past 2-1/2-MONTHS’ decline, we believe such a break is only a technicality at this point and that yields are in a major correction of at least the hike from Sep’17’s 2.047% low to 05-Oct’s 3.237% high.
The area around former 2.58%-area resistance from Mar’17 and the neighboring (2.57%) 50% retrace of Sep’17 – Oct’18’s 2.047% – 3.237% hike is a key support CANDIDATE, but only a downtrend-stemming bullish divergence in momentum will suffice in navigating the prospective end to a corrective slide and resumption of what easily could still be a secular move higher in rates.
On a shorter-term basis 13-Dec’s 2.915% corrective high serves as our new short-term but key risk parameter 10-yr rates need to recover above to confirm a bullish divergence in momentum, stem the rate slide and expose at least an interim corrective move higher. In lieu of such 2.915%+ rates, further and possibly accelerated rate losses remain expected.
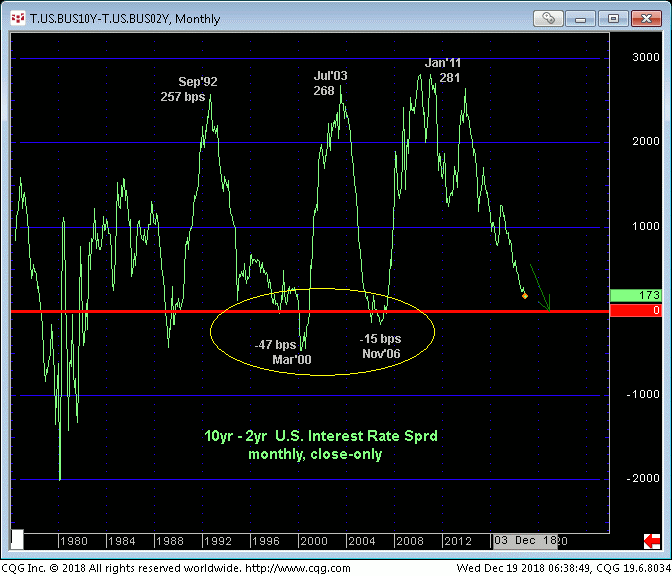
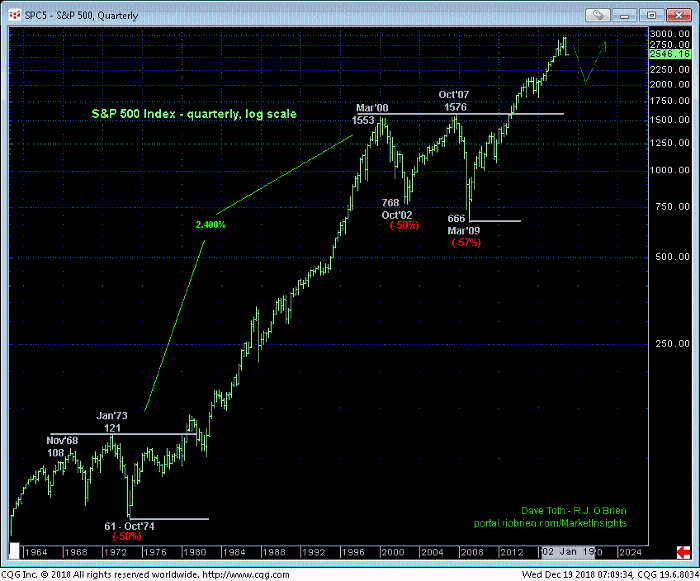
Lastly and importantly relative to a bullish count in the T-note contract prices AND downside vulnerability in equities is the extent to which the 2-yr/10-yr Treasury spread has narrowed. It’s easy to see in the monthly chart above that the past FIVE YEARS’ narrowing is of a historic scale similar to collapses in this spread between 2003 and Nov’06 and 1992-to-2000. In each prior case this condition led to MAJOR CORRECTIONS in the equity market easily seen in the quarterly log scale chart of the S&P 500 below. the cause-&-effect does not have to be immediate as the ultimate peak in S&Ps didn’t occur until Oct 2007. The 2000 connection was much more acute.
This said and as we’ve discussed often in our S&P updates the past two months, this S&P price action has satisfied exactly the peak/reversal behavior we require of reversals and currently leaves that market vulnerability to potentially severe losses until and unless threaten by strength above at least 2687 and preferably 2814.
In sum, a bullish policy remains advised in Mar T-Notes with a failure below 120.04 required to stem the rally and expose what we’d suspect at that point would only be an interim corrective setback. Such a sub-120.04 failure could also correlate with a similar BULLISH divergence in short-term momentum in the S&P 500 that would at least defer a broader bearish count enough to the point of some non-bearish action like short-covers. All-in-all, 2019 looks to be shaping up like a threatening year for equities and economy.
