MAR 10-Yr T-NOTES
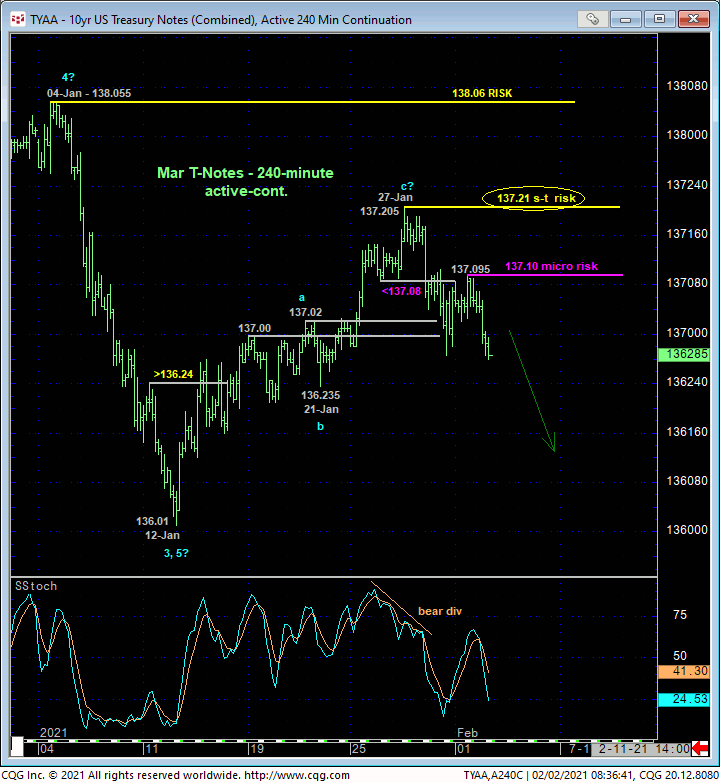
In 14-Jan’s Technical Blog following 13-Jan’s bullish divergence in short-term momentum that interrupted the major downtrend, we discussed a prospective correction if indeterminable scope while acknowledging the smaller-degree scale of that momentum failure. Not knowing the scope of the suspected correction- that could (and still might) call for a more protracted, multi-month correction of Aug-Jan’s entire 140.23 – 136.01 prospective 5-wave decline- we advised waiting for and requiring a recovery-stemming bearish divergence in momentum to identify a more reliable high and resistance that might define the correction’s end or upper boundary and a level from which non-bullish decisions like long-covers and resumed bearish punts can be objectively based and managed.
Starting with Thur’s micro mo failure below 26-Jan’s 137.08 minor corrective low and followed-up with today’s slip below Fri’s 136.285 initial counter-trend low, the 240-min chart below shows the market’s clear break of mid-to-late-Jan’s uptrend from 136.01 to 137.205. As the market remains a good bit away from 12-Jan’s obviously key 136.01 low, it’d be presumptuous and premature to CONCLUDE last week’s 137.205 high as the END of the correction from 136.01 and start of the resumption of what we believe is a new secular bear market in Treasuries. But the past few days’ erosion is certainly enough to define 137.21 as our new short-term risk parameter from which a resumed bearish policy by shorter-term traders can be objectively based and managed. And until this market recoups at least 137.21, there’s likewise no way to know that the major downtrend to sub-136 levels isn’t prepped to resume.
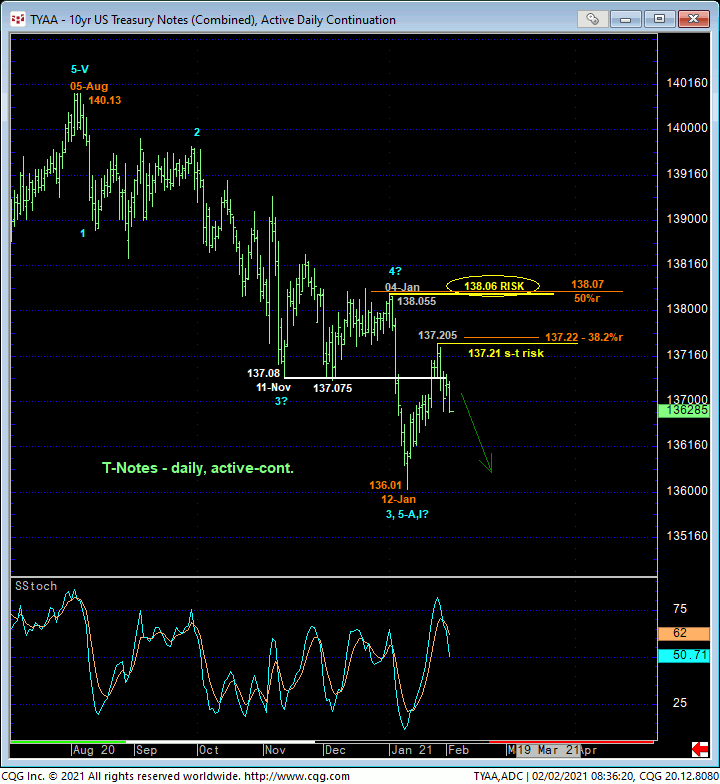
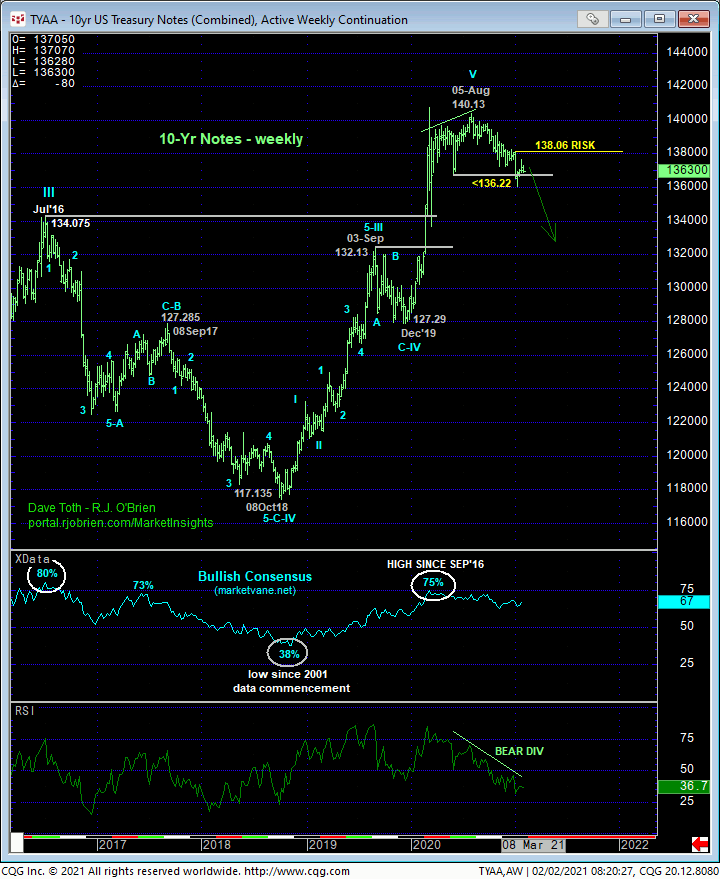
Only a glance at the daily active-continuation chart of the contract above or daily log close-only chart of 10-yr yields below is needed to see that the dominant trend remains arguably down in prices and up in yields. Commensurately larger-degree strength in the contract above at least 137.21 and preferably 04-Jan’s 138.055 larger-degree corrective high (below 04-Jan’s 0.912% corrective low in yield) remains required to, in fact, break Aug-Jan’s downtrend and confirm a major corrective recovery. In lieu of such commensurately larger-degree strength, a resumption of the major downtrend should hardly come as a surprise.
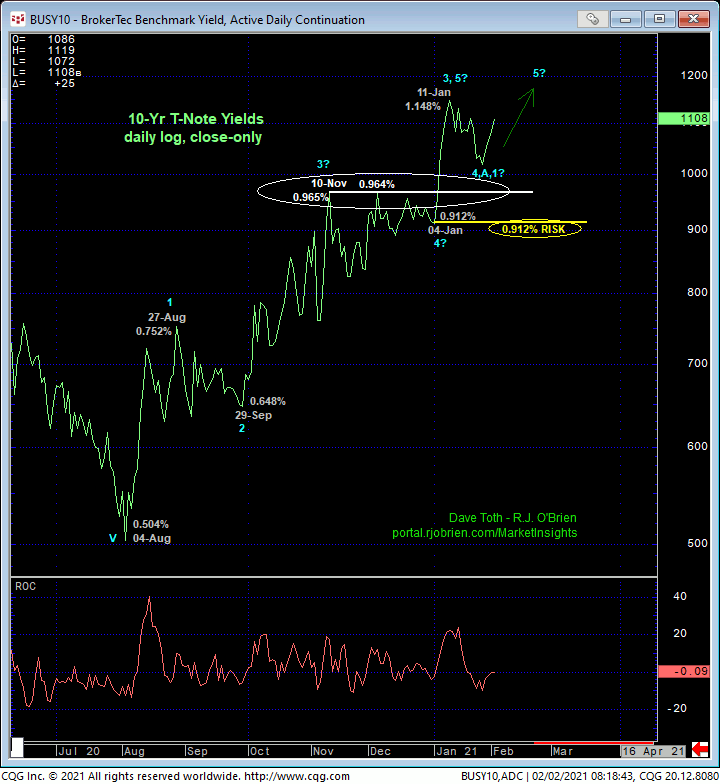
Finally, from a very long-term perspective, longer-term institutional players are reminded of the technical trifecta typical of all major peak/reversal environments:
- a confirmed bearish divergence in WEEKLY momentum amidst
- historically frothy bullish sentiment and
- an arguably complete (and in this case, massive) 5-wave Elliott sequence that dates from Oct’18’s 117.13 low.
These same technical elements, only inverted, described 2018’s major base/reversal process that took basically a YEAR to unfold before the proverbial “other shoe” dropped and the resulting bull trend took n prisoners in hardly looking back starting in Dec’18. With Jan’s break below last Jun’s pivotal 136.22 key corrective low confirming the trend break, extensive and potentially massive losses that could be generational in scope should not surprise.
These issues considered, a bearish policy and exposure remain advised for long-term institutional players with a recovery above 137.21 required to pare exposure t more conservative levels and commensurately larger-degree strength above 138.06 required to jettison remaining exposure altogether in order to circumvent the heights unknown of a major correction of Aug’20-Jan’21’s downtrend. Shorter-term traders whipsawed out of bearish exposure on 13-Jan’s bullish divergence in short-term momentum are advised to return to a cautious bearish policy from 137.00 OB with a recovery above 137.21 required to negate this specific call and warrant its cover. In lieu of at least a recovery above 137.21, we anticipate lateral-to-lower prices in the period ahead, including a possible resumption of the major downtrend below 136.00.
MAR GERMAN BUNDS
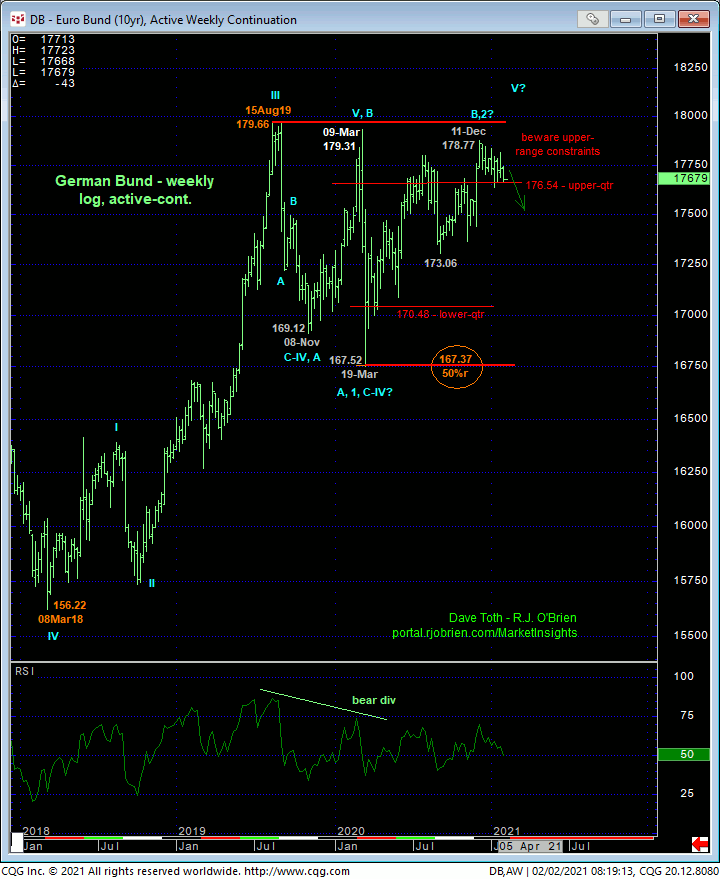
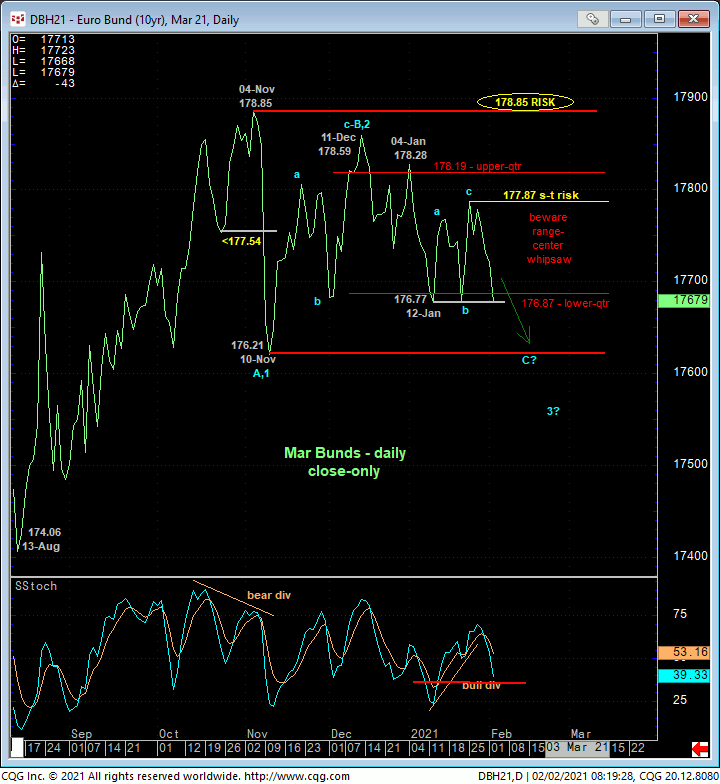
Against this major peak/reversal environment in Treasuries, we admit to erring on the side of a bearish count in bunds these past few months, especially following 09Nov20’s bearish divergence in momentum from the extreme upper recesses and thus resistance of its 16-month lateral range. The merely lateral price action since then has been a challenge and still cannot be ignored as a possible BULL market correction. But the fact that recovery attempts within this range are still very labored and corrective in their structure remains clearly within the bounds of a broader peak/reversal process. The extent of the past few days’ relapse is yet anther example that leaves the recovery attempt from 12.Jan’s 176.77 low close to 25-Jan’s 177.87 high close as a clear 3-wave and thus corrective event that warns of a resumption of at least Dec-Jan’s downtrend that preceded t, and possibly a resumption of Nov’s downtrend to eventual new lows below 176.21. A close above 177.87 is required to negate this call and perhaps tilt the longer-term directional biases to the bull side. Until such strength s proven, there’s n way to know hat the previously supportive lower-quarter of the 3-month range will hold once again.
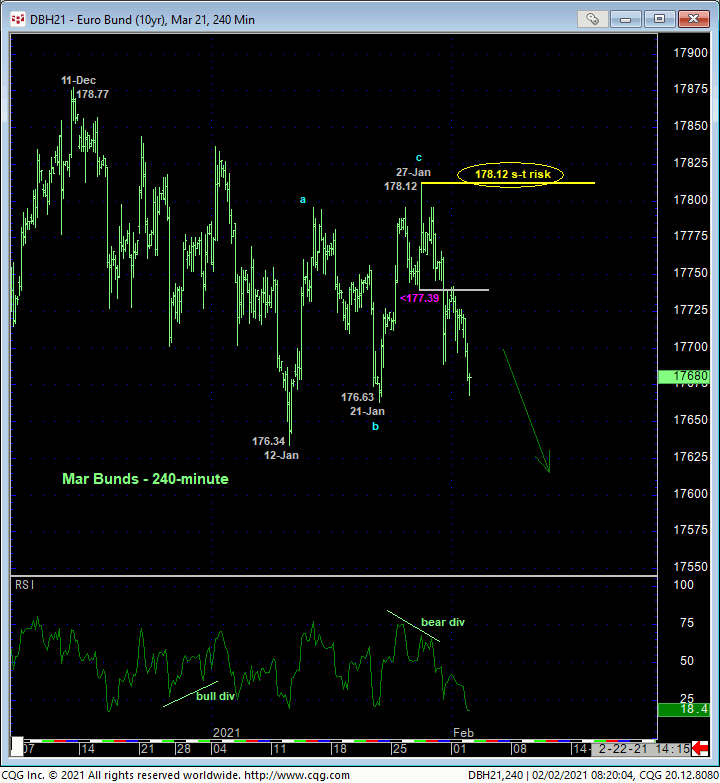
The 240-min chart below shows Fri’s bearish divergence in short-term momentum below last Wed’s 177.39 corrective low that defines 27-Jan’s 178.12 intra-day high as the end of a 3-wave and thus corrective affair from 12-Jan’s 176.34 low that now warns of a resumption of Dec-Jan’s downtrend that preceded it to eventual new lows below 176.34. A close above 177.87 and/or an intra-day recovery above 178.12 is required to negate this call and warrant the cover of resumed cautious bearish exposure.
On a major scale and especially given the peak/reversal-threat elements discussed above, only a glance at the weekly log active-continuation chart below is needed to see that the market’s proximity to and rejection thus far of the extreme upper recesses of its 17-month range questions the risk/reward merits of a bullish policy and would seem to reinforce a broader peak/reversal count.
These issues considered, a bearish policy remains advised for long-term institutional players with a recovery above 178.12 required to pare exposure to more conservative levels and commensurately larger-degree strength above 04-Nov’s 178.85 high close to neutralize remaining exposure altogether. Shorter-term traders subject to the not unexpected aimless whipsaw risk typical of the middle-halves of established ranges are advised to first approach intra-range recovery attempts to 177.25 OB as corrective selling opportunities with a recovery above 178.12 negating this call and warranting its cover. On the heels of the past few days’ slide, the market might not recover to this area to allow for the sale, but chasing bearish exposure near the lower recesses of the recent range and prospective support presents poor risk/reward metrics. In lieu of a recovery above 178.12, further and possibly accelerated losses should not surprise.
