
Posted on Mar 13, 2023, 07:48 by Dave Toth
JUN 10-Yr T-NOTES
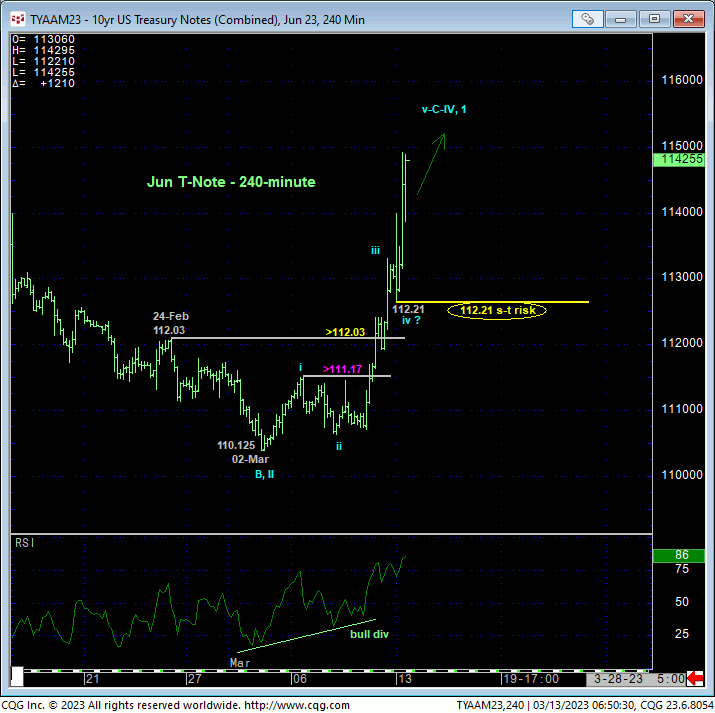
The extent and impulsiveness of Fri and today’s recovery, especially from the lower recesses of the past five months’ range, confirms our base/correction/reversal count discussed in Fri morning’s Technical Webcast that leaves overnight’s 112.21 low in its wake as the latest smaller-degree corrective low this market is now required to fail below to arrest the rally. In this regard, we’re defining 112.21 as our new short-term risk parameter from which non-bullish decisions like long-covers can be objectively based and managed. While we believe a “tighter” corrective low and short-term bull risk parameter will be identified before 19-Jan’s 116.08 key high and resistance repels this rally, IF it’s going to repel this rally, this 112.12 level is the tightest corrective low the market has identified thus far for this intra-five-month-range rebound.
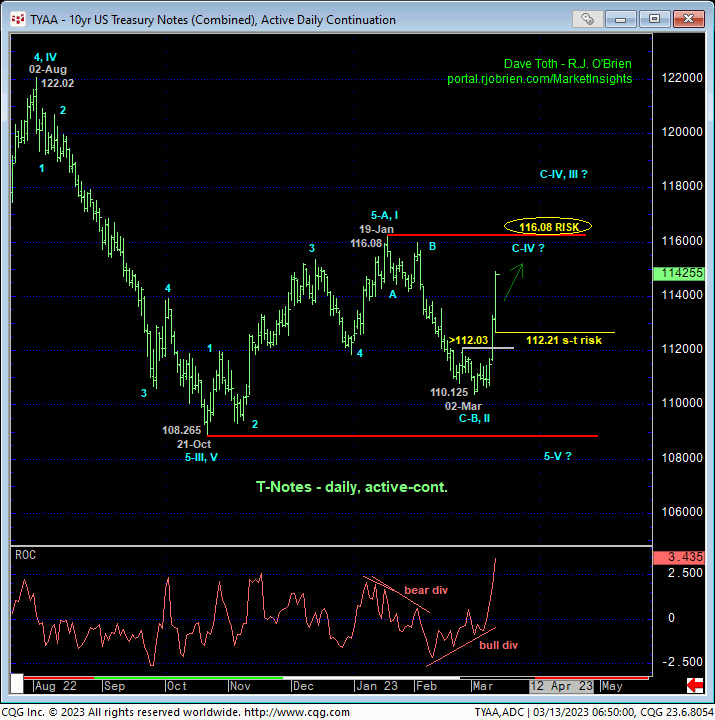
The daily chart of the contract (above) shows Fri and today’s sharp rally following Fri morning’s bullish divergence in momentum above 112.03. This chart also shows the market’s position still below 19-Jan’s 116.08 obviously pivotal high and key long-term bear risk parameter, the break above which will threaten the SECULAR bear market from 2020’s 140.13 all-time high. IF the past week’s intra-range recovery is just part of a continuation of the lateral (bear market) consolidation from 21Oct22’s 108.265 low, then we would expect a recovery-countering bearish divergence in momentum from some level shy of 116.08. A break above 116.08 could still fall well within the bounds of a major bear market correction, but as there are NO levels of any technical merit above 116.08, there would be absolutely no objective way in the world to know if such a 116.08+ move is the C-wave of a correction or the 3rd-wave of a reversal higher that would/could be very long-lived indeed. Per such, there will be NO objective reason whatsoever to maintain any bearish exposure whatsoever if/when this market breaks above 116.08, even for long-term institutional players.
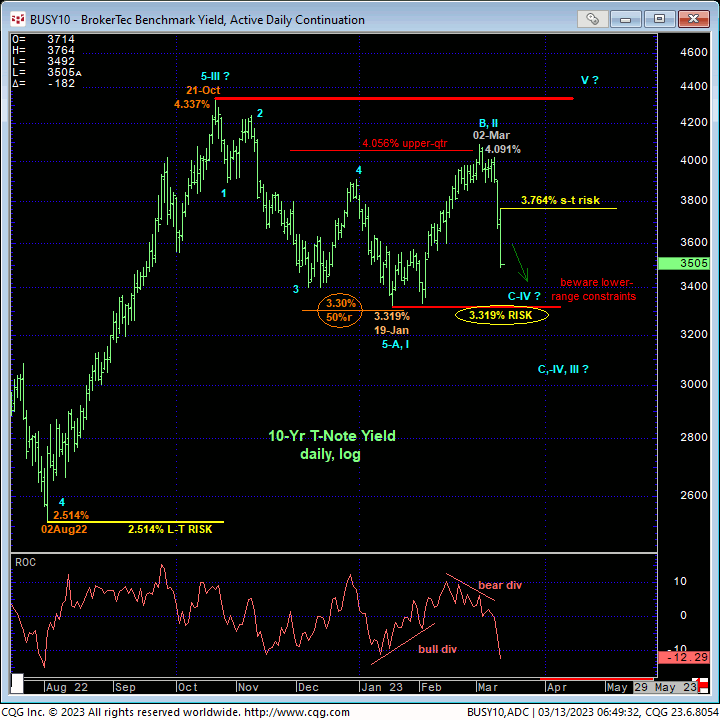
Basis 10-yr rates, the inverse applies with overnight’s 3.764% high and 19-Jan’s 3.319% low the clear key directional flexion points around which the risk of directional exposure can be objectively based and managed commensurate with one’s personal risk profile.
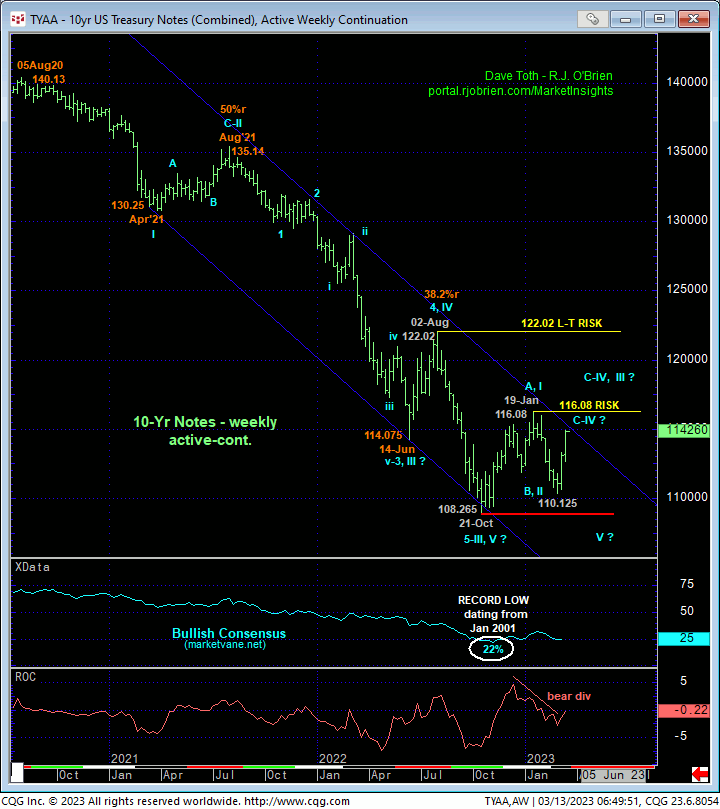
Finally, the monthly active-continuation chart below shows the sheer magnitude of 26-month secular bear trend that very arguably would be broken on a recovery above 19-Jan’s 116.08 high as such strength would render that high an initial counter-trend high and confirm a bullish divergence in MONTHLY momentum. The prospect that last Oct’s 108.265 low completed a massive, 26-month 5-wave Elliott sequence from Aug’20’s 140.13 would be hard to ignore if/when this market breaks 116.08.
These issues considered, a bullish policy and exposure remain advised for shorter-term traders with a failure below 112.21 required to defer or threaten this call enough to warrant moving to a neutral/sideline position. Long-term institutional players remain OK to maintain a conservative bearish policy with a recovery above 116.08 negating this call and warranting the immediate cover of any/all remaining bearish exposure to circumvent the heights unknown of a correction or reversal higher that may be major in scope.
JUN GERMAN BUNDS
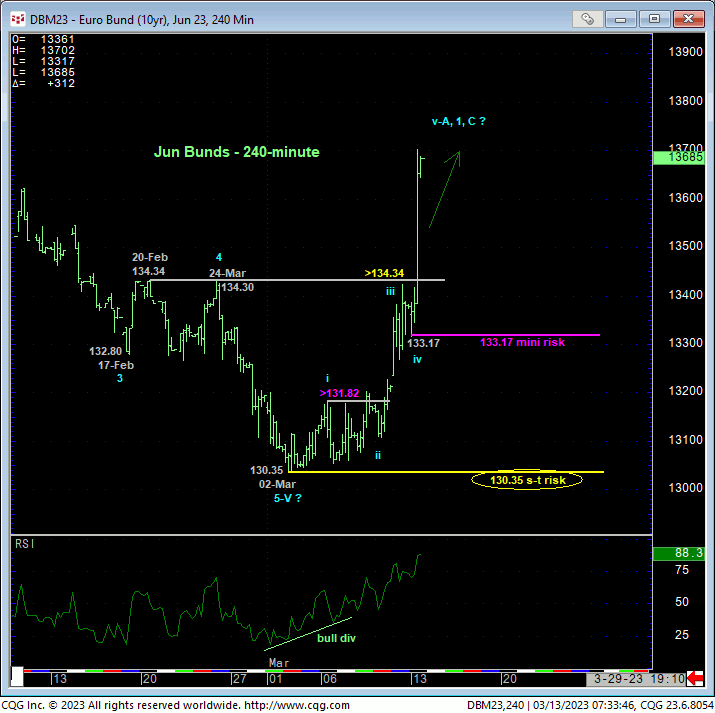
Similarly, the global flight-to-quality is also shown in the bund market with today’s clear, impulsive break above both 20-Feb’s 134.34 corrective high and 24-Feb’s 135.30 corrective high on an active-continuation basis (below) confirming a bullish divergence in momentum that confirms 06-Mar’s 130.35 low as the END of a 5-wave Elliott sequence that could be the completing 5th-Wave of the massive sequence down from Dec’20’s 178.77 orthodox high. as a result of the extent and impulsiveness of the past week’s rally, the 240-min chart above shows that the market has identified 02-Mar’s 130.35 low as one of obvious importance and today’s 133.17 low as the latest smaller-degree corrective low this market is now minimally required to fail below to arrest this clear and present and at least intermediate-term uptrend. Given the 3rd-wave accelerated nature of today’s portion of the rally however, we suspect at least one interim setback and another round of new highs to slow this rally down and create the potential for a bearish divergence in momentum. This behavior will allow us to tighten this mini bull risk parameter to the bottom of that interim corrective dip.
On a longer-term basis however, commensurately larger-degree strength above 19-Jan’s 140.73 larger-degree corrective high and key long-term bear risk parameter remains required to confirm a bullish divergence in WEEKLY momentum that would arguably threaten the 27-month secular bear market.
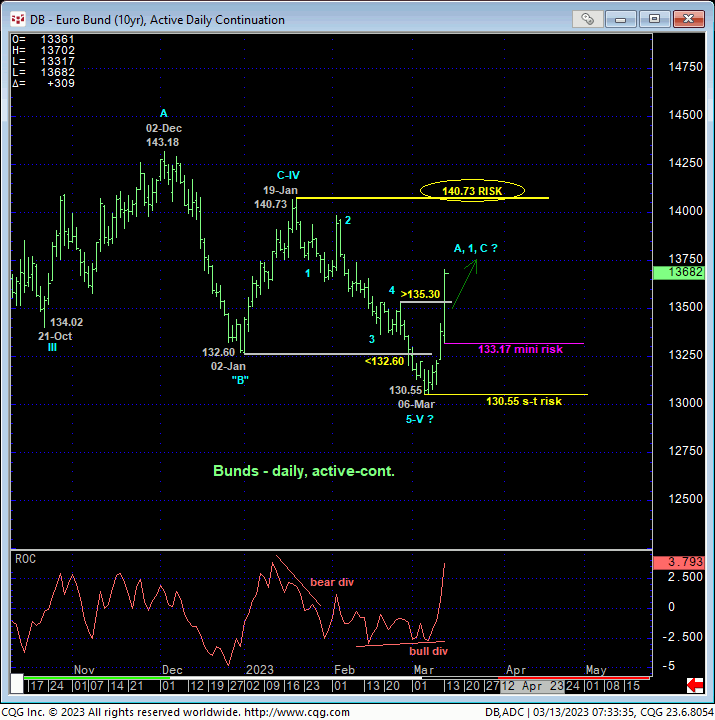
The weekly chart below shows the magnitude of the secular bear market and the importance of 19-Jan’s 140.73 larger-degree corrective high and key long-term bear risk parameter. A break above this level will confirm a bullish divergence in weekly momentum, arguably define 06-Mar’s 130.55 low as the end of a massive 5-wave Elliott sequence from Dec’20’s 178.77 orthodox high and expose a base/reversal count that could be major in scope. Per such, that 140.73 high remains intact as our key long-term bear risk parameter pertinent to long-term institutional players.
These issues considered, a bullish policy and exposure remain advised for shorter-term traders with a failure below 133.17 required to defer or threaten this call enough to warrant a move to the sidelines. A relapse below 130.55, obviously, is now required to mitigate this major base/correction/reversal threat and reinstate the secular bear. Commensurately larger-degree strength above 140.73 remains required to negate a long-term bearish count to the point where even long-term institutional players should neutralize any/all remaining bearish exposure and move to a neutral-to-cautiously-bullish stance.


