MAR 10-Yr T-NOTES
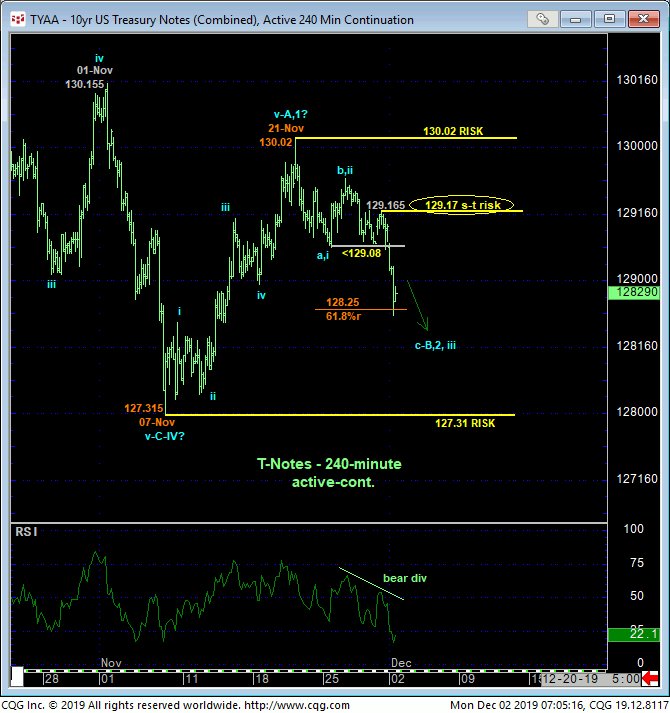
The extent of today’s break below 25-Nov’s 129.08 initial counter-trend low leaves Fri’s 129.165 high in its wake as a tight, intra-range but important corrective high that the market would/should be expected to sustain losses below if the market has something broader to the bear side in store. Its failure to do so will render the sell-off attempt from 21-Nov’s 130.02 high a 3-wave and thus corrective affair and reinforce a broader base/reversal count from 07-Nov’s 127.315 low. Per such, we are identifying 129.17 as our new short-term risk parameter from which shorter-term traders with tighter risk profiles can objectively base non-bullish decisions like long-covers and cautious bearish punts.
Former 129-1/4-area support would be expected to hold as new near-term resistance per any broader bearish count.
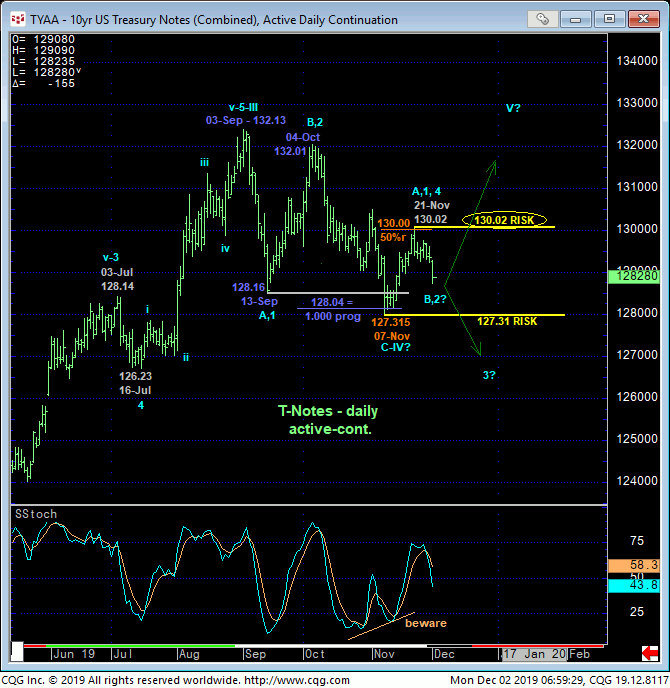
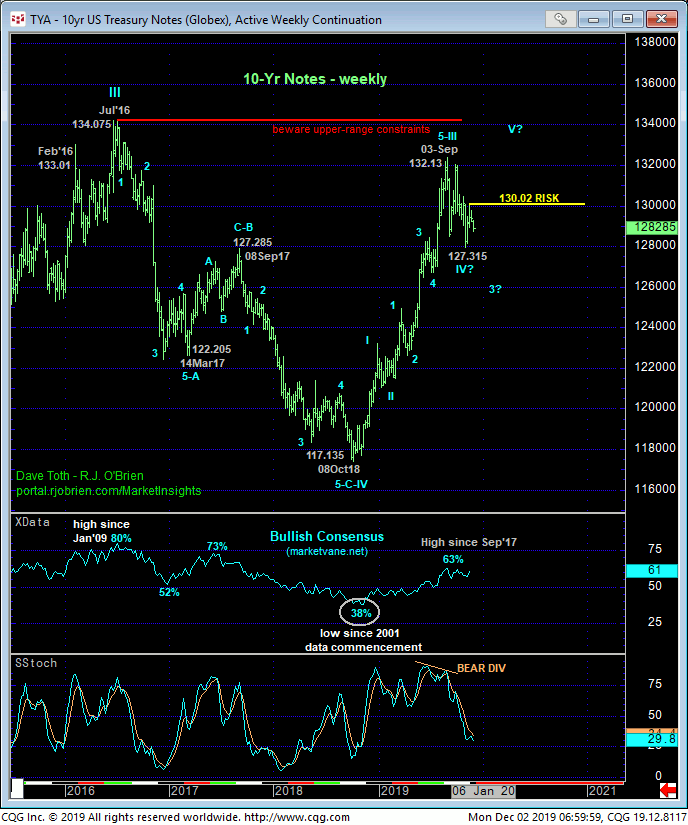
What remains a key technical issue given the past three months’ lateral price action is what move is correcting what. Against the backdrop of the secular bull trend from Oct’18’s 117.135 low, the sell-off attempt from 03-Sep’s 132.13 low THUS FAR remains only a 3-wave structure to 07-Nov’s obviously pivotal 127.315 low. A break below 127.31, which we are considering one of two key, longer-term risk parameters, will reinforce a broader peak/reversal count and could open the floodgates to protracted losses.
By the same token, a recovery above 21-Nov’s 130.02 equally important high will reinforce a count calling Sep-Nov’s 3-wave decline a correction ahead of a resumption of the secular bull to at least one more round of new highs above 132.13. OK, so great; we’re saying the market can either go down a lot or up a lot.
But here’s the applicable rub in the days and perhaps even hours immediately ahead: If the latter, bullish count is what the market ultimately has in mind, then the market cannot break 07-Nov’s 127.315 low. This would mean that today’s short-term weakness has very limited remaining downside potential and would likely be stemmed by a bullish divergence in short-term momentum imminently. The 240-min chart above shows today’s 128.235 low thus far being only 3/64s away from the (128.25) 61.8% retrace of Nov’s 127.315 – 130.02 rally.
If there’s a time and place for a corrective relapse to end, we believe it would be here and now. So traders are advised to be watchful for a bullish divergence in short-term mo in the day or two ahead from current mid-to-upper-128-handle-area prices. IF and when such a bullish divergence in mo is confirmed, the risk/reward merits of a bullish punt could be exceptional. Until and unless such a mo failure stems the clear and present intermediate-term downtrend, there’s no way to to know this slide won;t accelerate and eventually demolish -7-Nov’s 127.31 low.
From a long-term perspective, the past three months’ erosion still falls well within the bounds of a mere correction within the secular bull trend. By the same token however, the combination of the market’s recent proximity to Jul’16’s 134.075 all-time high, a bearish divergence in weekly momentum and the highest market sentiment levels in two years cannot be ignored as a warning of a peak/reversal threat that could be major in scope. On this broader scale a recovery above a key risk parameter at 130.02 remains required to defer this threat resurrect a broader bullish count.
These issues considered, a neutral-to-cautiously-bearish policy is advised with a recovery above 129.17 flipping the script and warranting a move to a cautious bullish policy. Subsequent strength above 130.02 would reinforce a longer-term bullish count while a break below 127.31 will reinforce a bearish count that could produce protracted losses thereafter. Acknowledge and be flexible to a significant move either way, toggling directional biases and exposure around the specific and objective flexion points defined above.
DEC GERMAN BUNDS
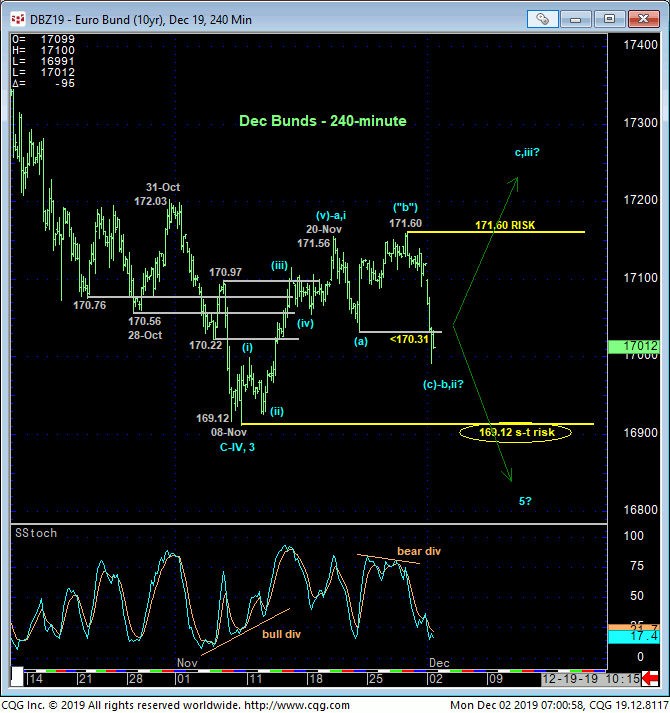
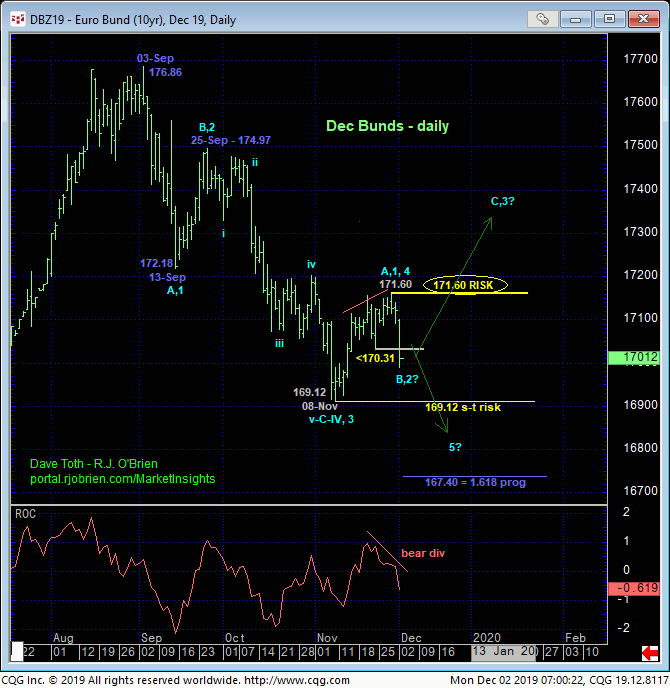
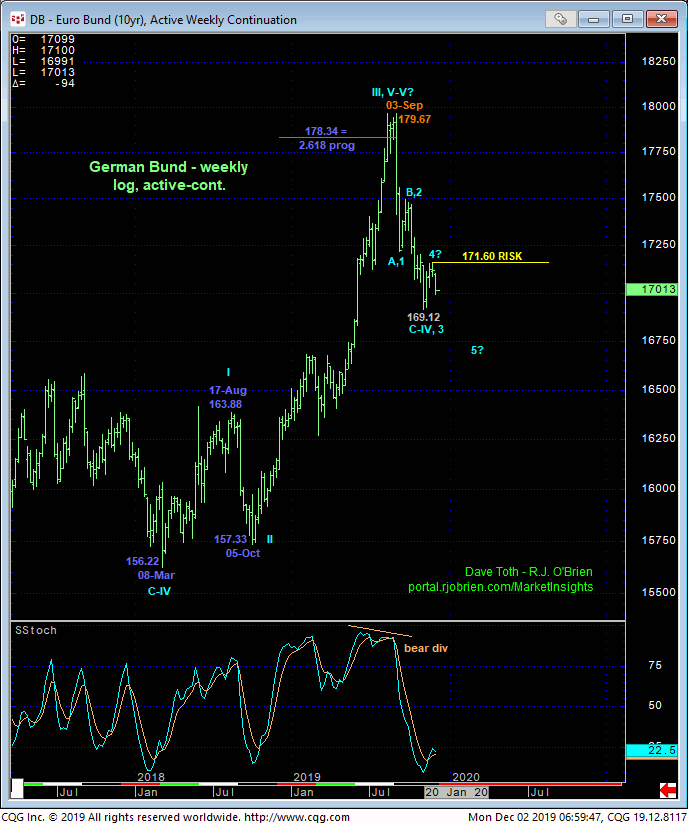
For most intents and purposes, we believe the technical construct of the Dec bund market is identical to that detailed above in T-notes with 28-Nov’s 171.60 high and 08-Nov’s 169.12 low the key long-term flexion points around which longer-term directional biases and exposure are advised to be toggled. From a shorter-term perspective however, traders are urged to be watchful for a bullish divergence in short-term momentum from current 170.00-area prices needed to arrest the current intra-range swoon and reinforce a count that suggests this relapse is part of the past couple weeks’ mere correction of mid-Nov’s 169.12 – 171.56 rally within a broader base/reversal environment. Until and unless such a mo failure stems the current slide, there’s no way to know this slide won’t accelerate and demolish 08-Nov’s 169.12 low. In sum, a neutral/sideline policy is advised for the time being. We have our eyes peeled on a prospective bullish divergence in short-term mo and will update customers immediately as it develops.
JUN20 EURODOLLARS
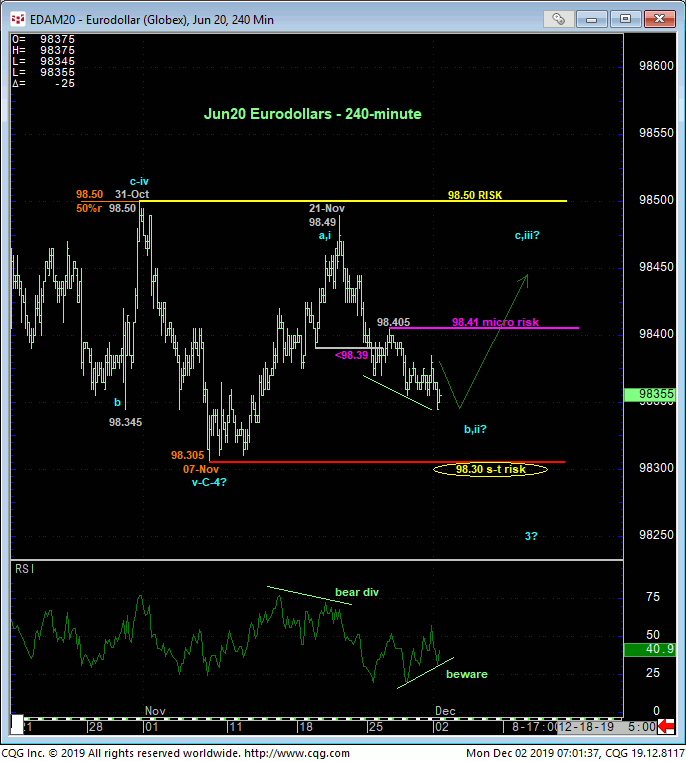
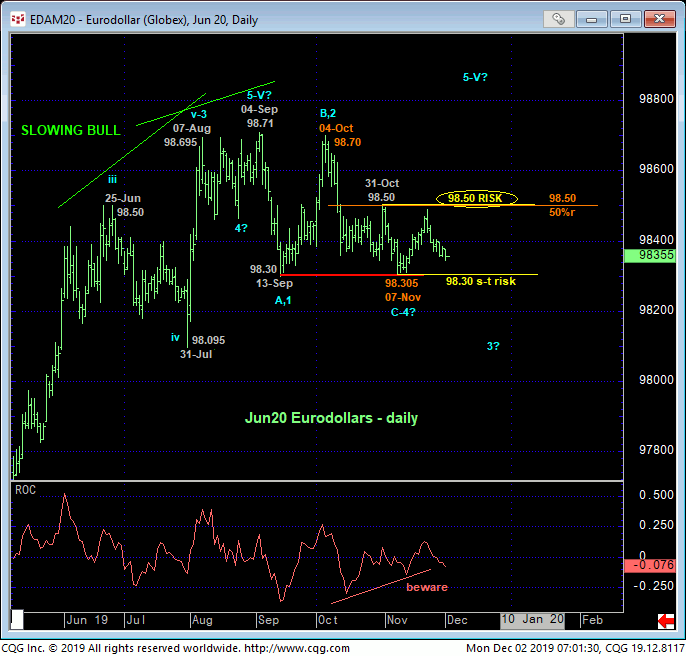
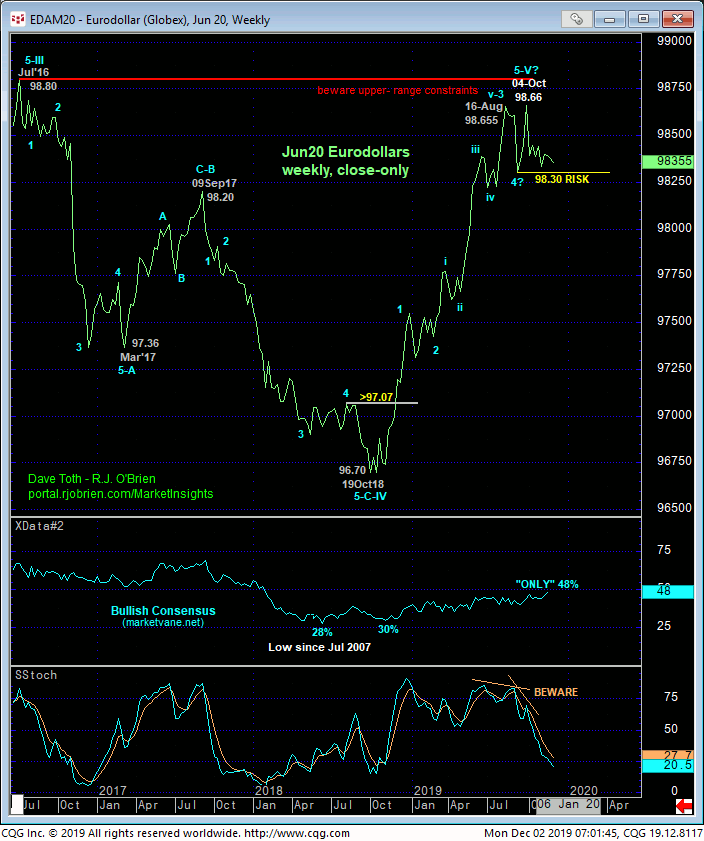
The technical construct for Jun20 Eurodollars is identical to that detailed above for T-notes with the key directional flexion points at 98.41, 98.50 and 98.30. A neutral-to-cautiously-bearish policy is OK with a recovery above 98.41 warranting a shift to a cautious bullish stance. 98.50 and 98.30 are the obviously key longer-term flexion points around which longer-term directional biases and exposure can be objectively based and managed.
