Posted on Mar 20, 2023, 08:18 by Dave Toth
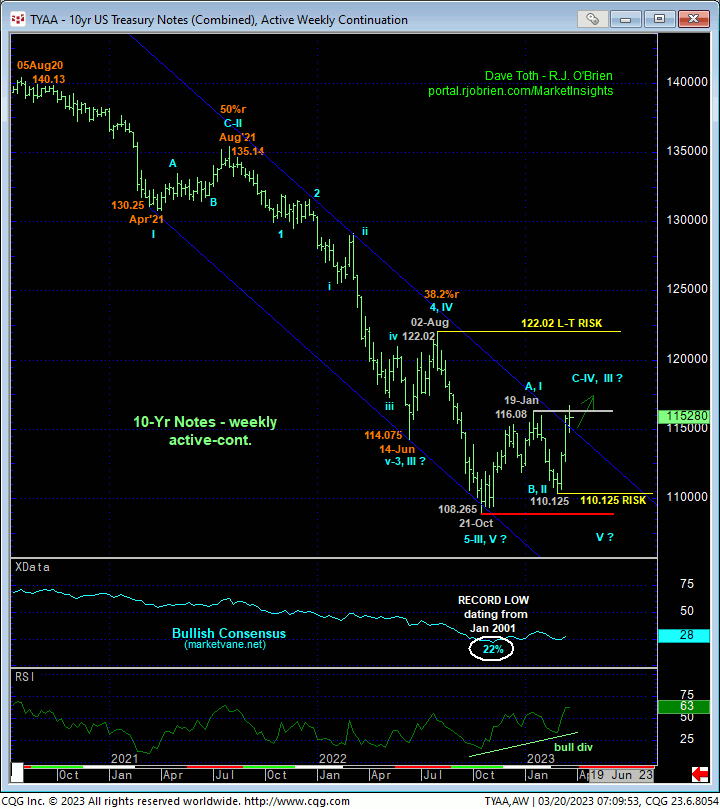
JUN 10-Yr T-NOTES
Overnight’s break above 19-Jan’s 116.08 high and our key long-term bear risk parameter renders that high an initial counter-trend high and confirms a bullish divergence in WEEKLY momentum. Combined with what has been historically bearish levels in the Bullish Consensus (marketvane.net) not seen in over 20 years and an arguably complete and massive 5-wave Elliott sequence that dates from Aug’20’s 140.13 all-time high as labeled in the weekly chart below, the market has confirmed a major base/correction/reversal count introduced in 10-Mar’s Technical Webcast when the market first confirmed a bullish divergence in short-term momentum from the lower-quarter of the past five months’ range.
Given the magnitude of 2020 – 2022’s 26-month secular bear market, could the recovery attempt from 21Oct22’s 108.265 low be just a larger-degree bear market correction? Sure, absolutely. But as a direct result of today’s break above 19-Jan’s 116.08 high (and below that day’s 3.319% yield low we’ll discuss below), this market has clearly identified 02-Mar’s 110.125 low as THE low this market must now relapse below to render the recovery attempt from the Oct low a 3-wave and thus corrective structure needed to mitigate a major bullish count and reinstate the secular bear. Until and unless such sub-110.125 weakness is shown, there’s no way to know the rally from that low isn’t the dramatic 3rd-Wave of a major reversal higher that could span QUARTERS.
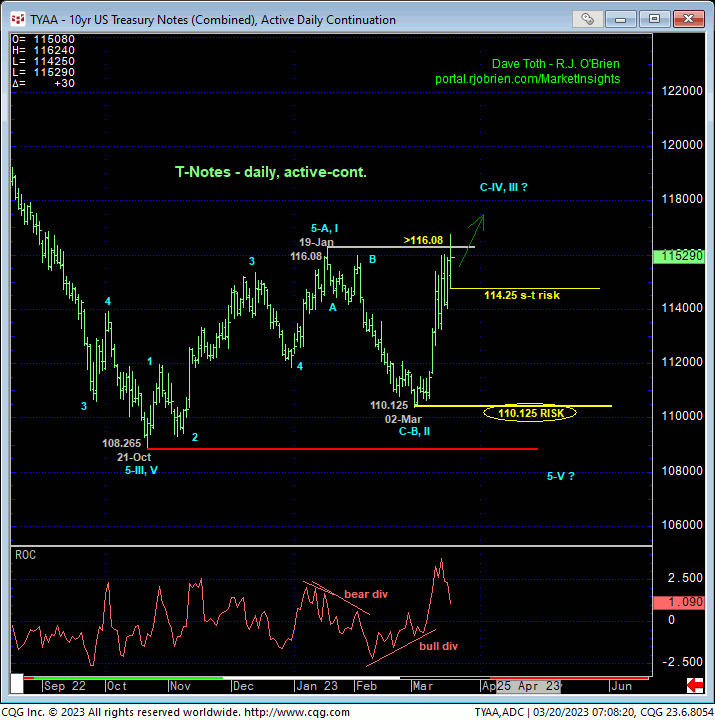
The daily chart of the Jun contract above shows today’s RESUMPTION of Oct-Jan’s initial rally from 108.265 to 116.08. This rally from 110.125 can only be one of two things: the completing C-Wave of a major bear market correction OR the dramatic 3rd-Wave of a major reversal higher. Always biasing towards a wave count that is WITH the trend, traders are advised act on the premise that this market is poised to take off in a 3rd-Wave up.
This bullish bias is not just a “Trend is your friend” conclusion. Rather, it has everything to do with objective and acceptable RISK DEFINITION. Specifically, we know precisely what the market has to do to negate a new bullish count: fail below 02-Mar’s 110.125 low. This bull risk is specific and objective. Conversely, if one fades this rally as a prospective completing C-Wave to a bear market correction, there is NO level above the market shy of 02Aug22’s 122.02 corrective high that suffices in negating this bearish bet. None.
Could we see an interim correction of just the past few weeks’ rally from 02-Mar’s 110.125 low within this broader base/reversal threat? Sure, and as we’ll detail below, we will navigate such a corrective dip on a short-term mo failure below overnight’s 114.25 smaller-degree corrective low and short-term bull risk parameter.
On a 10-yr yield basis, the daily log chart below shows our new short- and long-term risk parameters to a new major move lower at 3.519% and 4.091%, respectively.

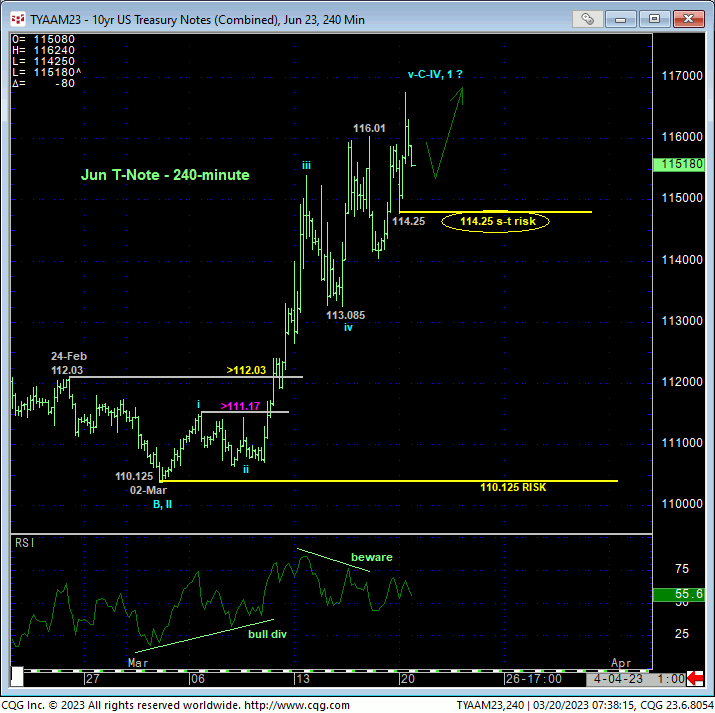
Drilling down to a short-term scale, the 240-min chart below details this month’s recovery. By virtue of today’s break above Thur’s 116.01 high, the market has identified overnight’s 114.25 low as the latest smaller-degree corrective low this market now needs to sustain gains above to maintain a more immediate bullish count. Its failure to do so will confirm a bearish divergence in short-term momentum and threaten the uptrend from 02-Mar’s 110.125 low enough that shorter-term traders with tighter risk profiles would/should want to pare or neutralize bullish exposure in order to circumvent the depths unknown of an interim corrective setback. In lieu of weakness below at least 114.25, the trend is up on all practical scales and should not surprise by its continuance or acceleration straight away.
These issues considered, a bullish policy and exposure remain advised for shorter-term traders with a failure below 114.25 required to defer or threaten this call enough to warrant a move to the sidelines. Longer-term institutional players have been advised to neutralize any remaining bearish exposure on today’s recovery above 116.08 and are further advised to move to a new long-term bullish policy until and unless the market fails below 110.125. This said, “chasing” new bullish exposure “up here” presents poorer risk/reward metrics given assumed risk to 110.125, so only cautious, conservative exposure is advised at this juncture. We suspect interim corrective setbacks along the way that we believe will provide preferred risk/reward buying opportunities. In lieu of a failure below at least 114.25 however, further gains straight away should not surprise.
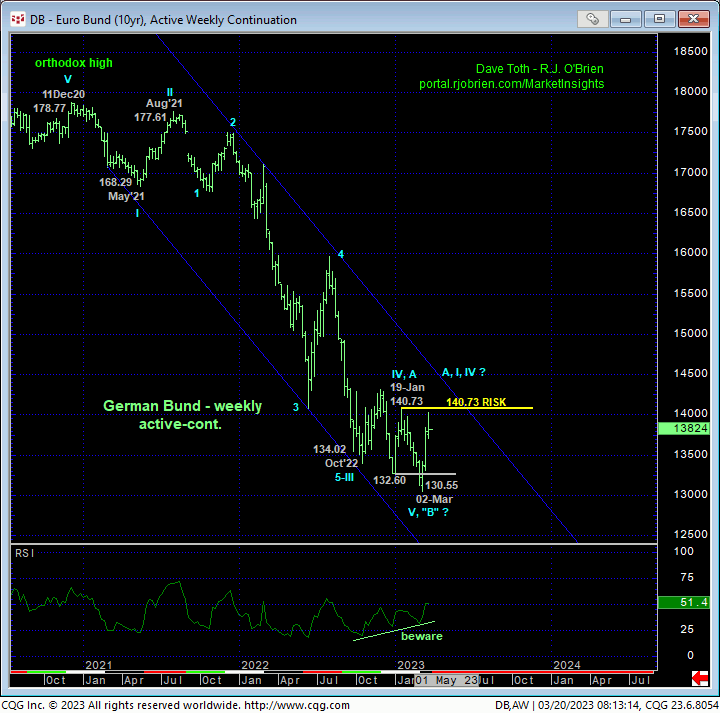
JUN GERMAN BUNDS
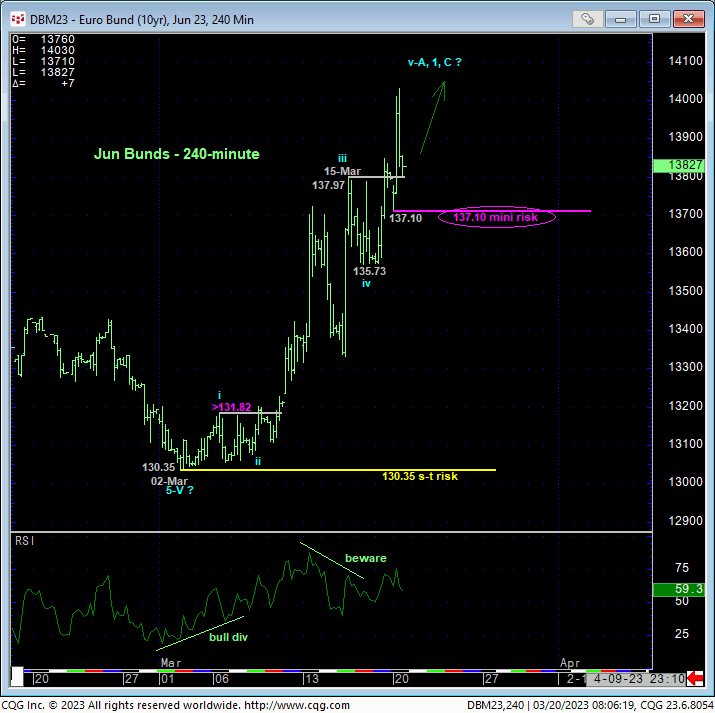
The correlation between U.S. T-notes and German bunds remains a very positive one, so the extent and impulsiveness of this month’s recovery in the Jun bund from 02-Mar’s 130.35 low is expected. The only difference between the two markets, and one that we believe is a mere technicality, is that the bund has yet to take out its larger-degree corrective high from 19-Jsan at 140.73. Per such and from a discipline standpoint, we’re maintaining that level as a long-term bear risk parameter. Other than that, the extent and impulsiveness of this month’s rally is every bit as impressive as that detailed above in T-notes with overnight’s 137.10 low considered the latest smaller-degree corrective low and our new mini bull risk parameter as well as 02-Mar’s 130.35 low that is one of obvious developing importance and another clear risk parameter from which non-bearish decisions like short-covers and bullish punts can be objectively based and managed.
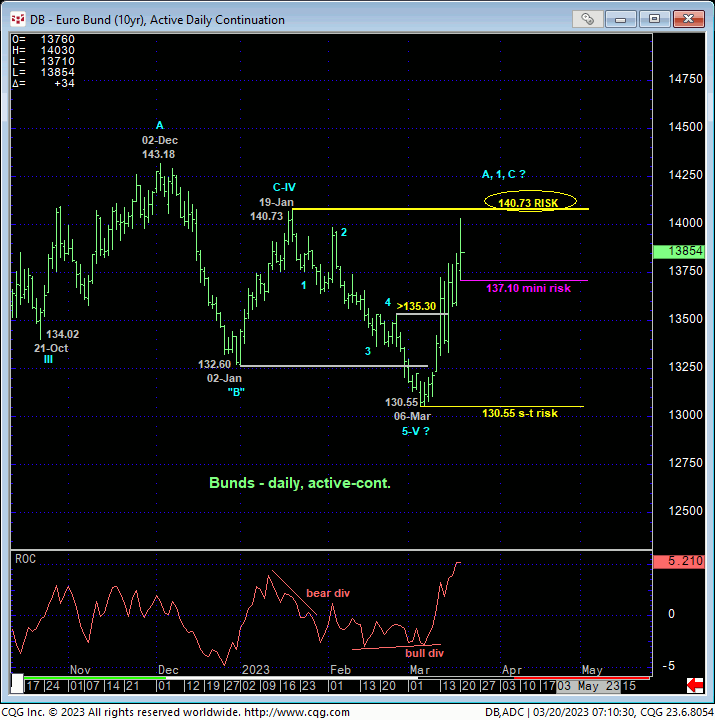
From a long-term perspective shown in the monthly chart below, the prospect that the decline from Dec’20’s orthodox high of 178.77 to 02-Mar’s 130.55 low is a complete and massive 5-wave Elliott sequence as labeled cannot be ignored. It is arguably premature to CONCLUDE such a count, but further strength above 19-Jan’s 140.73 will be another and perhaps the final nail in the coffin for such a count, reaffirming a major correction or reversal higher.
These issues considered, a bullish policy and exposure remain advised for shorter-term traders with a failure below 137.10 deferring or threatening this call enough to warrant defensive measures. Commensurately larger-degree weakness below 130.35 is now required to mitigate a major base/correction/reversal count and reinstate the secular bear. And while the market has yet to breach 19-jan’s 140.73 high, long-term institutional players are advised to neutralize any remaining cautious bearish exposure and first approach setbacks to this month’s rally as corrective buying opportunities. In lieu of a relapse below at least 137.10, further gains remain anticipated.