DEC 10-Yr T-NOTES
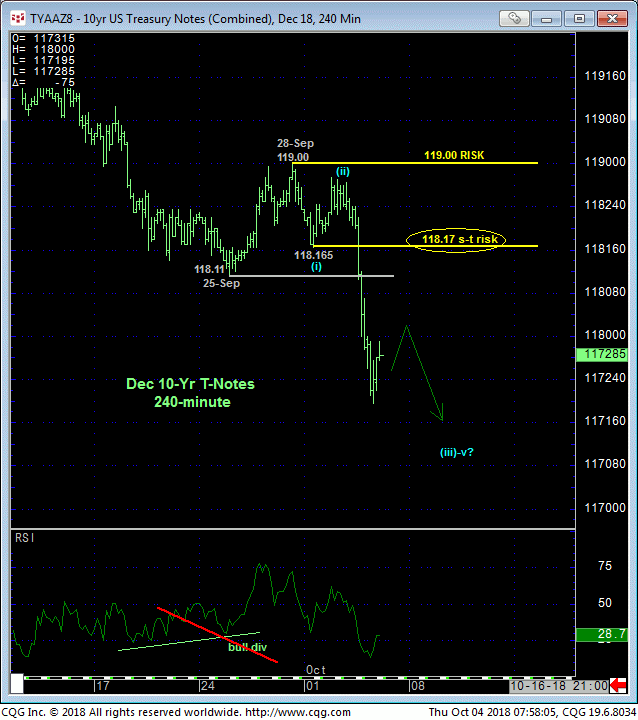
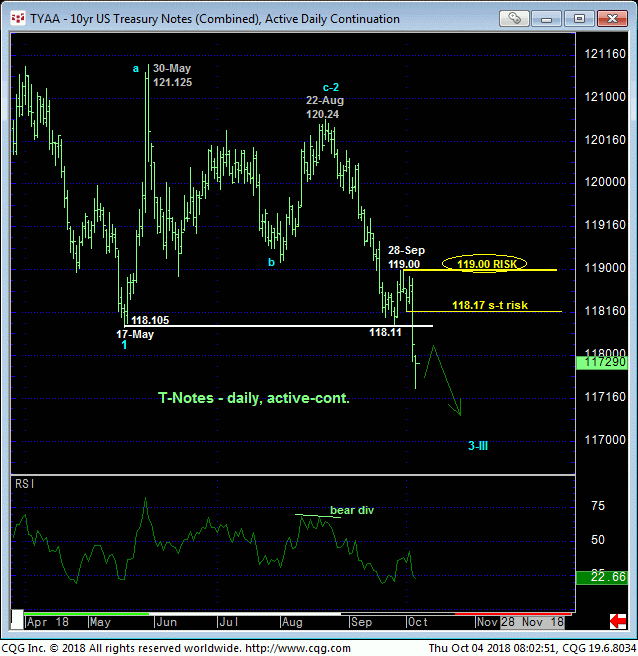
Yesterday’s collapse below 25-Sep’s 118.11 low nullified the bullish divergence in short-term momentum discussed in 27-Sep’s Technical Blog and left 28-Sep’s 119.00 high in its wake as the latest corrective high this market is now required to recover above to negate a more immediate bearish count. In this regard that 119.00 high is considered our new long-term risk parameter from which longer-term players can objectively rebase and manage the risk of a still-advised bearish policy and exposure.
Of the resumed decline from 119.00, Mon’s 118.165 low looks to be a minor 1st-Wave down that the market is expected to sustain losses below to maintain the impulsive integrity of a more immediate bearish count. Per such, we are marking 118.17 as our new short-term risk parameter from which shorter-term traders can manage the risk of a resumed bearish policy after last week’s whipsaw resulting from that bullish divergence in short-term mo.
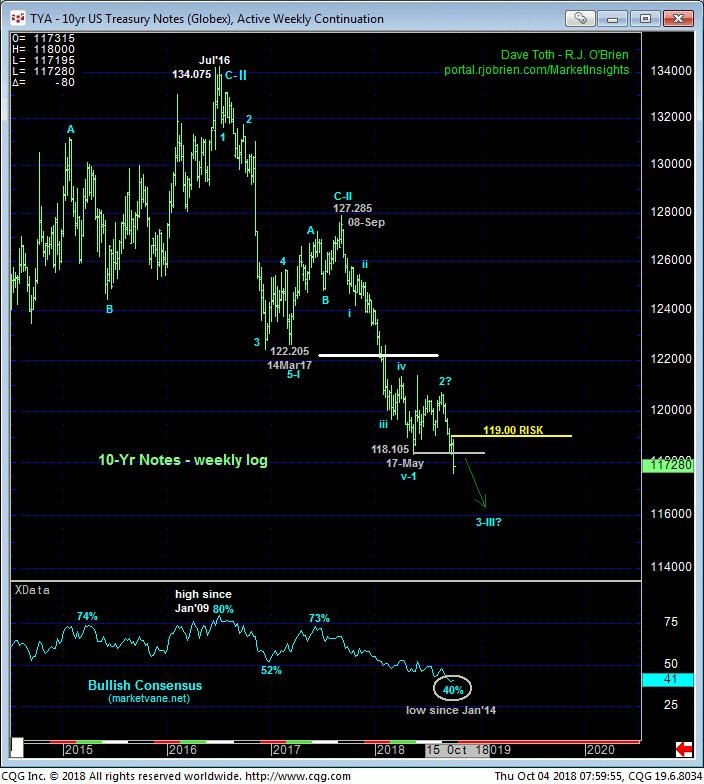
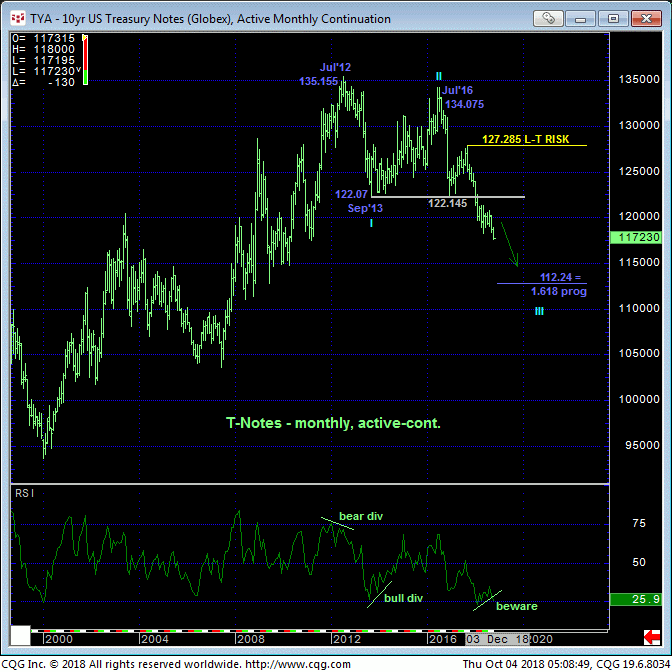
The weekly (above) and monthly (below) log scale charts show the resumption of the secular bear market that, again, we believe could provide the same type of generational move higher in rates as the generational move lower in rates from 1981 to 2016. The trend is down on all scales and should not surprise by its continuance or acceleration. ALL technical levels of merit only exist ABOVE the market in the forms of former support-turned-resistance (like the 118.11-area) and prior corrective highs like 28-Sep’s 119.00 high.
Market sentiment levels are understandably historically bearish with the Bullish Consensus (marketvane.net) posting a 40% reading recently, its lowest in nearly five years and typical of major BASE/reversal environments. In the absence of a confirmed bullish divergence in momentum of a scale sufficient to break the major downtrend however, sentiment/contrary opinion is not an applicable technical tool.
In sum, a full and aggressive bearish policy and exposure remain advised for longer-term players with a recovery above 119.00 required to negate this call. Shorter-term traders whipsawed out of bearish positions following last week’s bullish divergence in short-term mo are advised to first approach recovery attempts to 118.04 OB as corrective selling opportunities with a recovery above 118.17 required to threaten this call enough to warrant its cover. The market’s downside potential is indeterminable and potentially extensive, possibly spanning years.
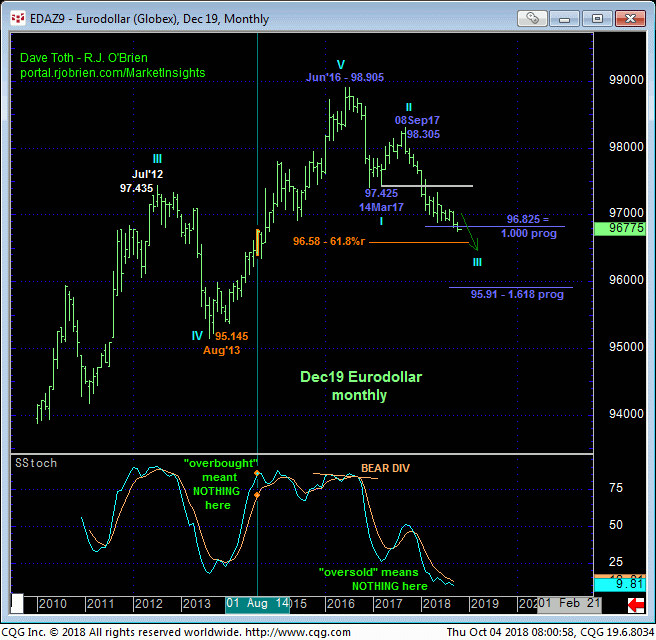
DEC19 EURODOLLARS
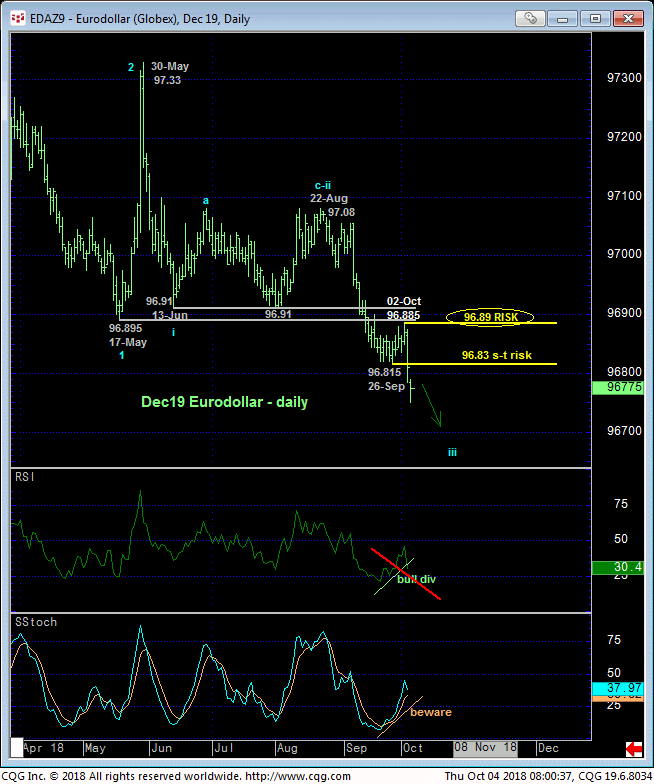
The technical construct and expectations for Dec19 Eurodollars is identical to that detailed above for 10-yr T-Notes following yesterday’s impulsive resumption of the secular bear market below 26-Sep’s 96.815 low. Former 96.82-area support is expected to hold as new near-term resistance with 02-Oct’s 96.885 high the latest key corrective high and risk parameter the market is now required to recoup to threaten a bearish policy and exposure and warrant its cover. In lieu of strength above at least 96.83 and preferably 96.89, the trend is down on all scales and is expected to continue and possibly accelerate.
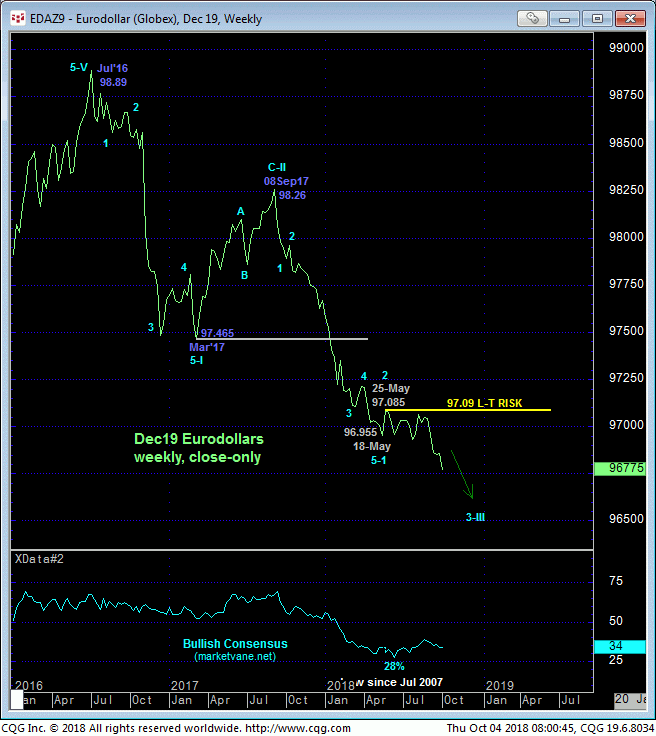
The resumed secular bear trend is clear in the weekly close-only chart above and monthly chart below with all pertinent technical levels only above the market in the forms of former support-turned-resistance like 96.82 and prior corrective highs like 96.89. Until and unless the market recovers above these levels, further and possibly protracted losses that could span years remain expected.
