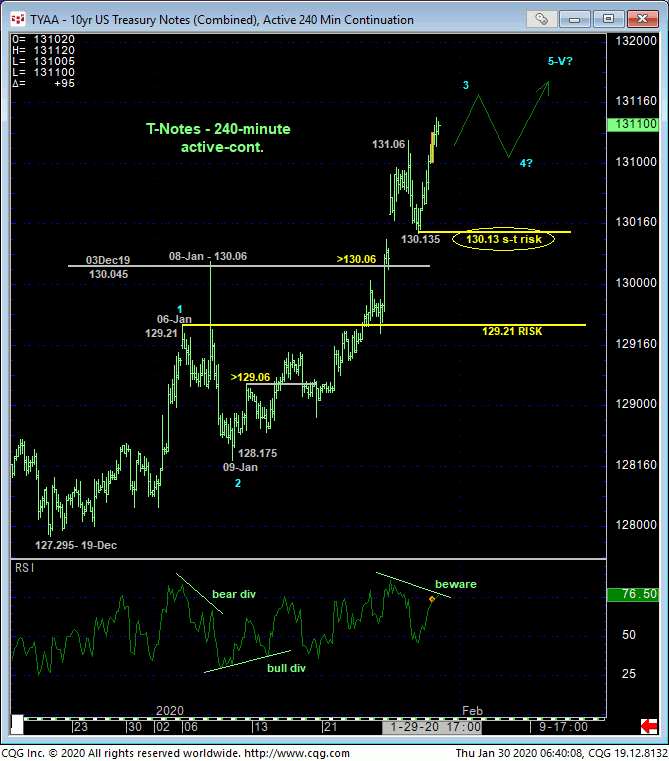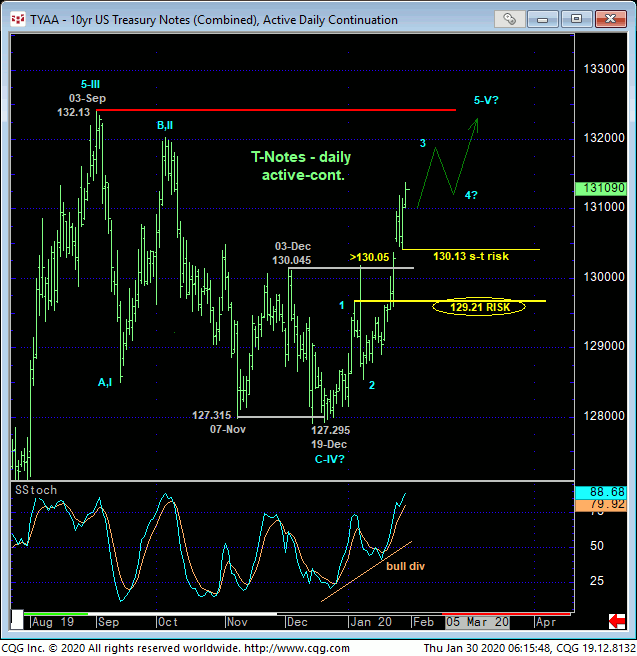

Threats to a broader bearish count began with early-Jan’s bullish divergence in shorter-term momentum as introduced in 06-Jan’s Technical Blog. Now, after 24-Jan’s recovery above the pivotal 130.05-area, subsequent trendy, impulsive price action higher reinforces a count calling for a resumption of the secular bull trend after a clear 3-wave and thus corrective structure to Sep-Dec’s 132.13 – 127.295 decline as labeled in the daily chart below.
Overnight’s break above Tue’s 131.06 high detailed in the 240-min chart above reaffirms the developing uptrend and leaves yesterday’s 130.135 low in its wake as the latest smaller-degree corrective low the market is now minimally required to fail below to confirm a bearish divergence in short-term mo, stem the rally and expose at least an interim correction lower. Per such, we are defining 130.13 as our new short-term risk parameter from which shorter-term traders with tighter risk profiles can objectively rebase and manage the risk of a still-advised bullish policy and exposure.

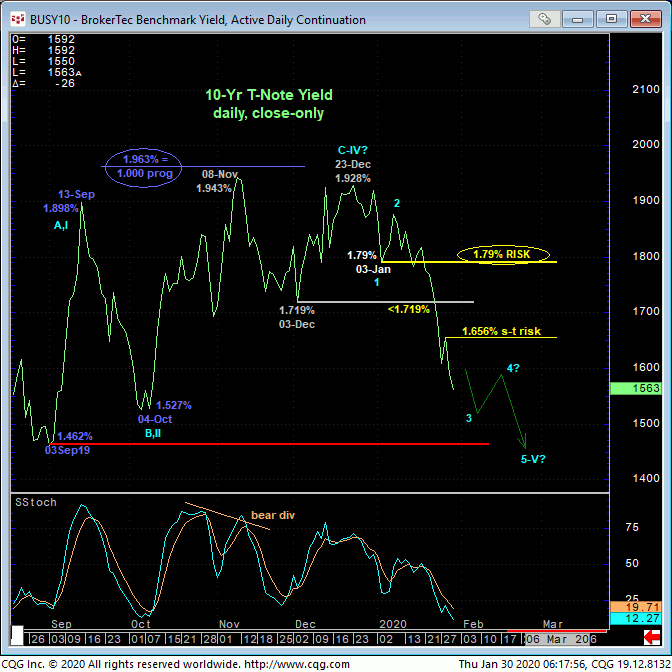
Looking at actual 10-yr yields in the daily close-only chart below, 28-Jan’s 1.656% minor corrective high is analogous to our 130.13 short-term risk parameter in the contract. From a longer-term perspective, 03-Jan’s 1.79% low is assumed to be the 1st-Wave down of an eventual 5-wave sequence down from 23-Dec’s 1.928% high. If this (5-wave-down) bearish count is correct, this market shouldn’t come anywhere near that 1.79% threshold, the recovery above which would render Dec-Jan’s rate relapse a 3-wave and thus corrective event that would resurrect a broader base/reversal count in rates and peak/reversal count in the contract. We’re defining the analogous longer-term risk parameter to a resumed long-term bullish count in the contract at 06-Jan’s 129.21 high. This is our key bull risk parameter for long-term players.
These 130.13 and 129.21 risk parameters may come in handy as this market engages the upper recesses of the past four months’ 132.13 – 127.29-range in the contract and lower recesses of its 1.46% – 1.93%-range in rates. Until and unless the contract stems its clear and present and developing uptrend with a failure below at least 130.13 and preferably 129.21, further and possibly accelerated gains should not surprise.

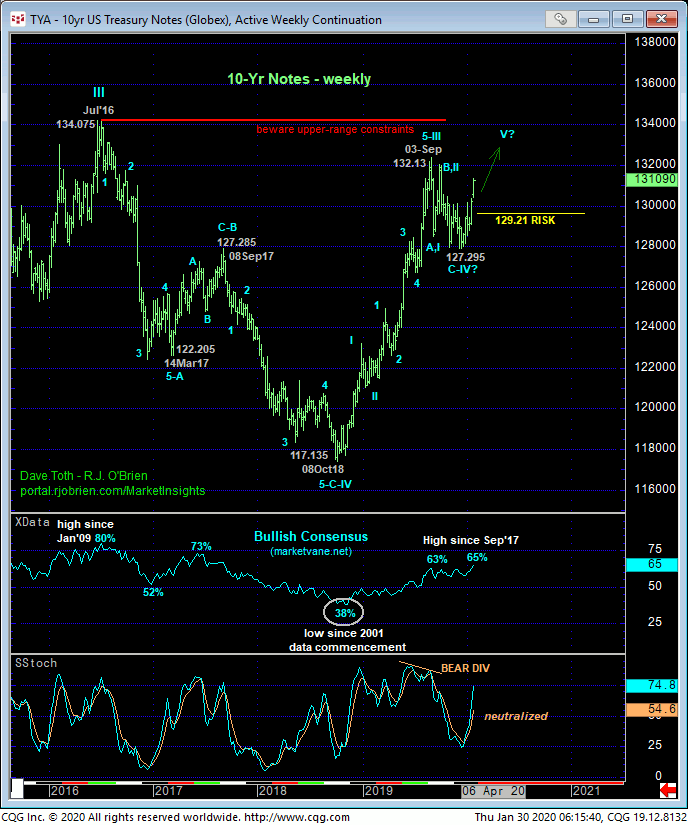
The weekly chart below shows the magnitude of the secular bull trend from Oct’18’s 117.13 low and how relatively minor Sep-Dec’s relapse attempt appears, well within the bounds of a mere (4th-Wave) correction ahead of one final (5th-Wave) gasp by the bull that could provide another golden opportunity for long-term debt financing and mortgage re-fis. A likely contributing factor to such continued strength in Treasuries however is, unfortunately, the threat of a larger-degree correction in equities. As we don’t expect anything more than a slightly larger-degree corrective setback in equities however, we would also surmise any final poke higher in the T-Note contract to be short-lived.
These issues considered, a bullish policy and exposure remain advised with a failure below at least 130.13 required for shorter-term traders to move to the sidelines. Commensurately larger-degree weakness below 129.21 is required for long-term players to neutralize exposure. In lieu of such weakness,, further and possibly accelerated gains should not surprise.


