MAR 10-Yr T-NOTES
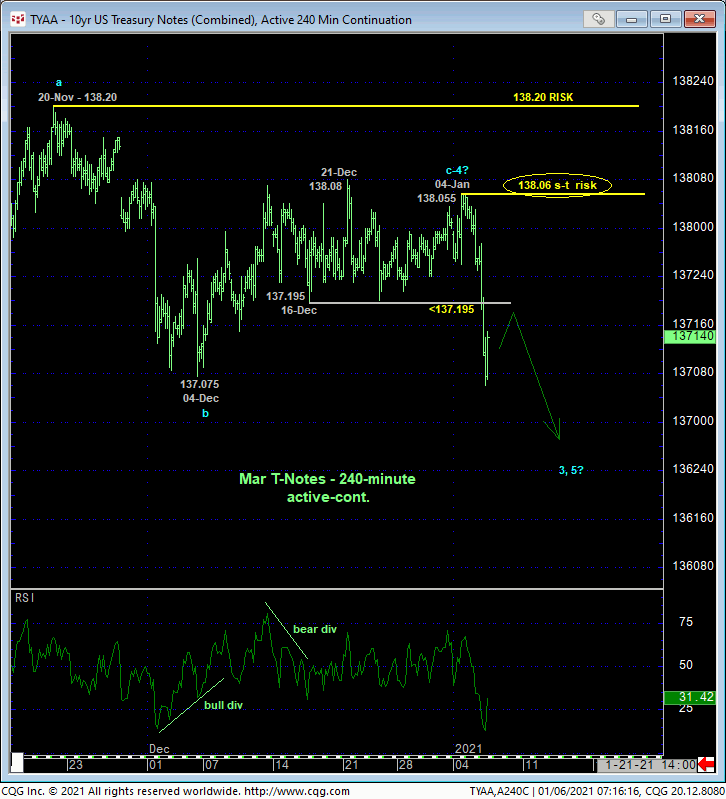
Overnight’s sharp, impulsive break below 16-Dec’s 137.195 low and our short-term risk parameter renders the one-month recovery attempt from 04-Dec’s 137.075 low to 04-Jan’s 138.055 high a corrective/consolidative affair that reinstates our major peak/reversal count introduced in 11Aug20’s Technical Webcast. Today’s resumed weakness leaves Mon’s 138.055 high in its wake as the latest smaller-degree corrective high this market is now minimally required to recoup to jeopardize the impulsive integrity of a more immediate bearish count and resurrect an interim correction. Per such, we’re defining 138.06 as our new short-term risk parameter from which shorter-term traders with tighter risk profiles can objectively rebase and manage the risk of a resumed bearish policy and exposure.
Former 137-3/4-area support of the past few weeks, since broken, is considered new near-term resistance ahead of further and possibly steep losses.
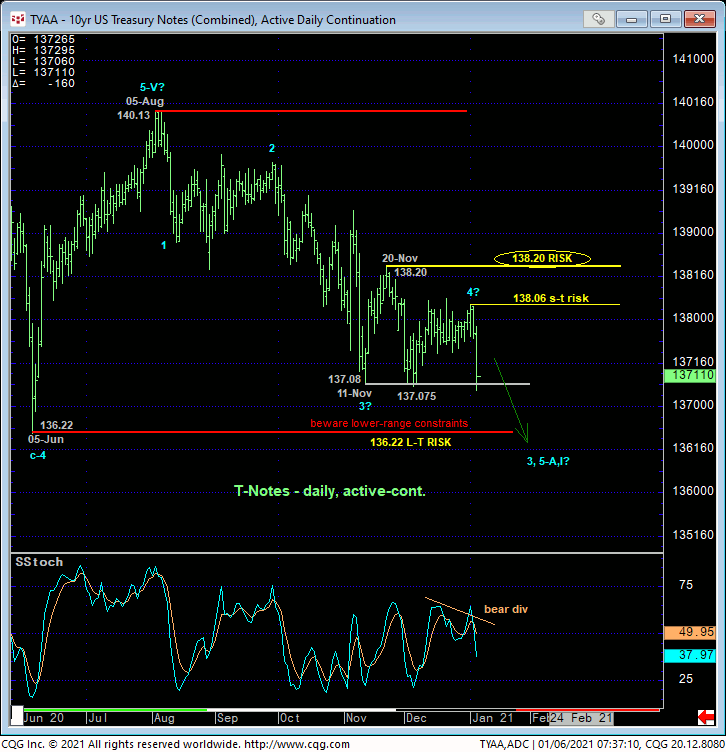
The daily active-continuation chart above shows today’s resumption of what is now fives months of peaking/reversal behavior. A short-term recovery above our short-term risk parameter at 138.06 would be a threat t the bear to be sure, but commensurately larger-degree strength above 20-Nov’s 138.20 next larger-degree corrective high and key risk parameter remains required to break the 5-month downtrend and expose what we’d then believe is a just 2nd-Wave correction within a peak/reversal process that could be generational in scope.
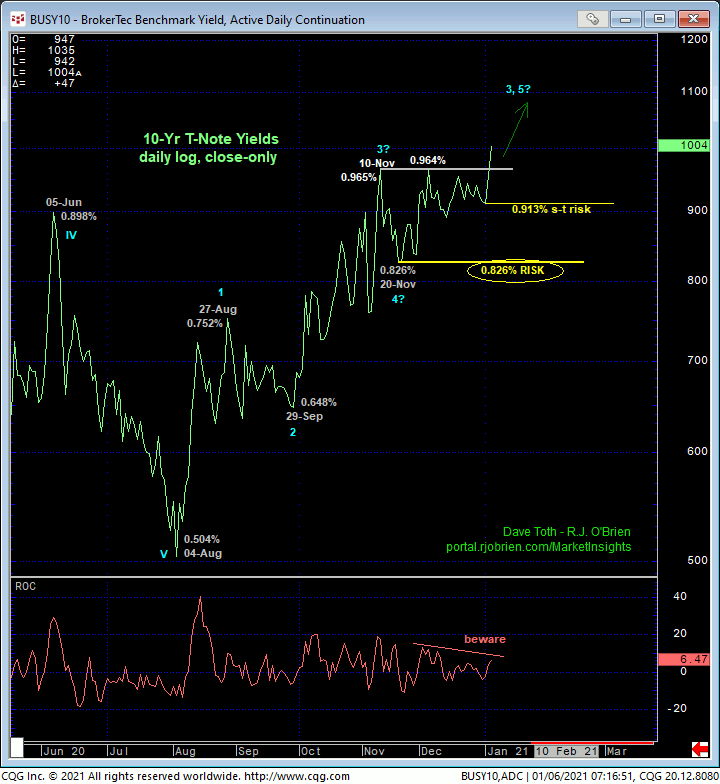
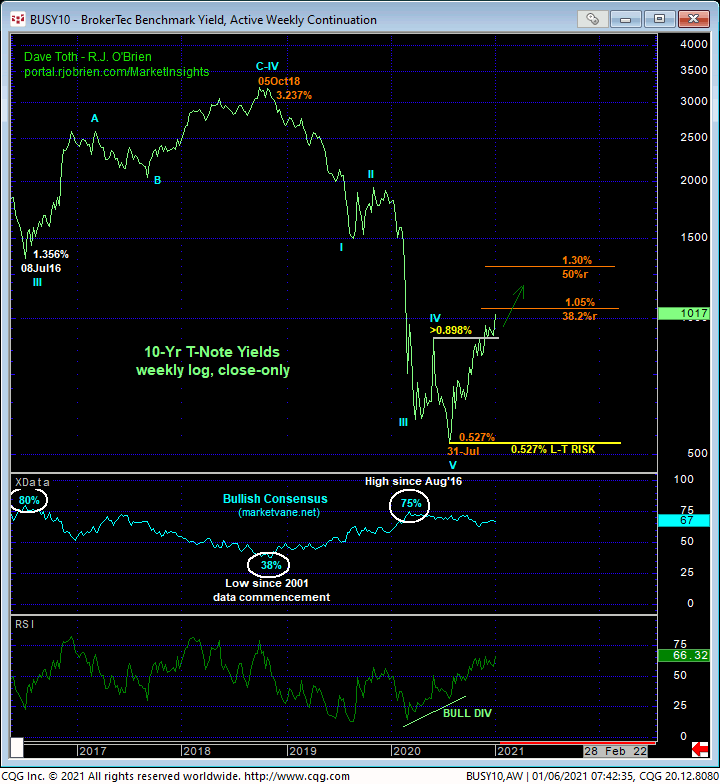
Similarly but inversely, the daily log close-only chart of 10-yr yields below shows today’s clear break above the past couple months’ 0.96%-area resistance and prospective “double-top” that reinstates the new and we believe secular bull trend in rates. Smaller- and larger-degree corrective lows are left in the wake of this resumed rate rise at 0.913% and 0.826%, respectively, that now serve as our new short- and long-term risk parameters to a policy calling for higher, and possibly much higher rates straight away. Former 0.96%-area resistance is considered new near-term support.
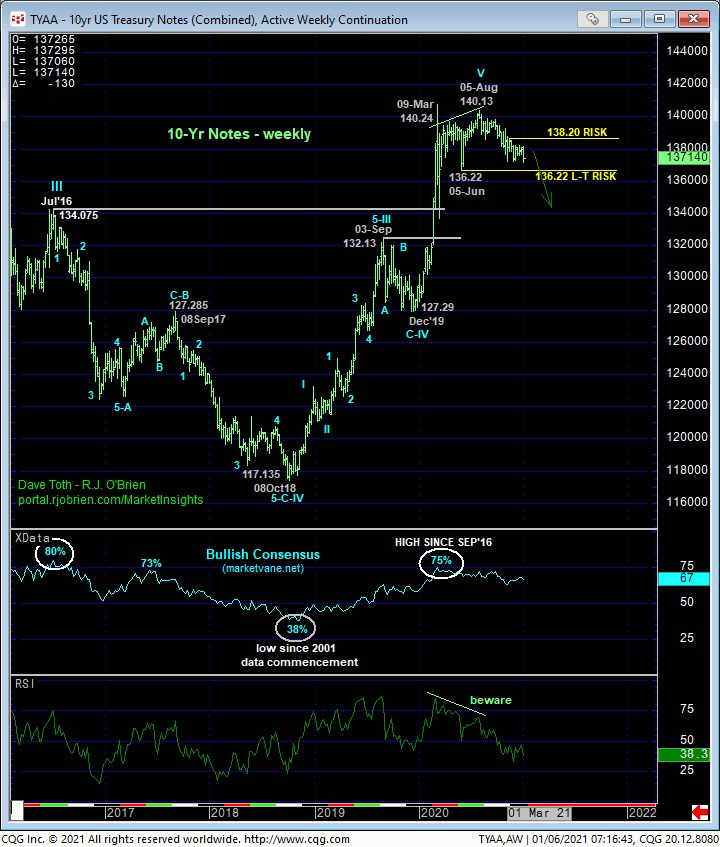
The lone remaining technical level of any merit below the market in the contract is 05Jun20’s 136.22 major corrective low shown in the weekly chart above. A failure below this level will confirm a massive bearish divergence in momentum that will, in fact, break the two-year uptrend from Oct’18’s 117.13 low and reinforce our major peak/reversal count. Such a major mo failure would confirm the trifecta of technical factors typical of virtually all major reversal environments:
- a confirmed bearish divergence in momentum amidst
- historically frothy sentiment (in this case, not seen since that that warned of and accompanied Jul’16’s major peak/reversal), and
- a complete 5-wave Elliott sequence (in this case, up from Oct’18’s 113.13 low as labeled above).
This said, it should be noted that on a yield basis, the weekly log close-only chart below shows that the market has already confirmed this divergence and broken Oct’18 – Jul’20’s complete 5-wave downtrend.
These issues considered, a bearish policy and exposure remains advised for longer-term institutional players with a recovery above 138.06 required to pare exposure to more conservative levels and commensurately larger-degree strength above 138.20 to neutralize exposure altogether to circumvent the heights unknown of a suspected (2nd-Wave) corrective rebound. Shorter-term traders whipsawed out of bearish exposure following 08-Dec’s bullish divergence in short-term mo are advised to resume a bearish policy and first approach recovery attempts to 137.19 B as corrective selling opportunities with a recovery above 138.06 required to negate this specific call and warrant its cover. In lieu of a recovery above at least 138.06, further and possibly protracted losses straight away should not surprise.
MAR GERMAN BUNDS
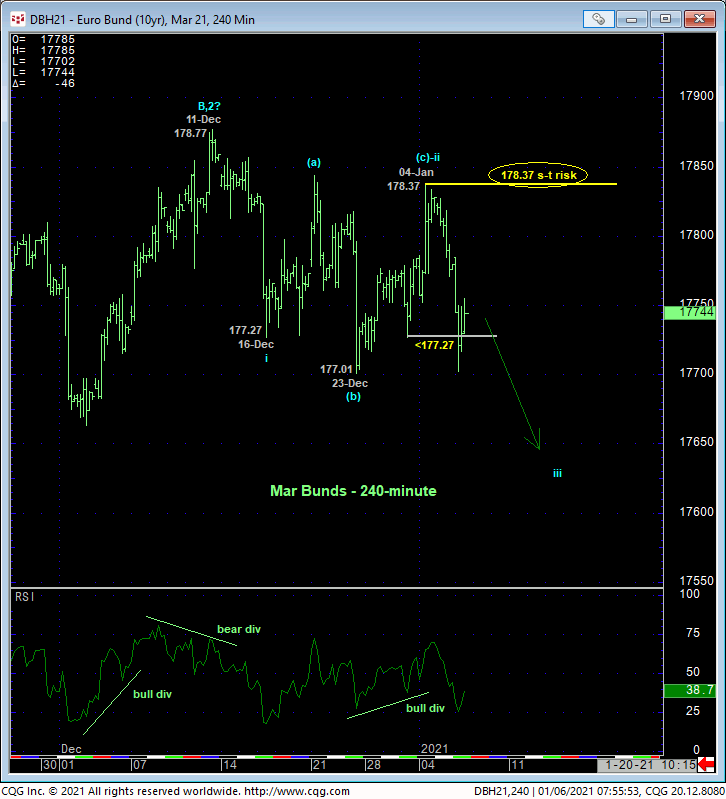
Bund weakness concurrent with Treasury weakness is hardly a surprise and the 240-min chart below shows today’s relapse below 30-Dec’s 177.27 low and our short-term risk parameter that renders the latest recovery attempt from 23-Dec’s 177.01 low another 3-wave and thus corrective affair consistent with a broader peak/reversal-threat environment. The important by-product of this latest spate of weakness is the market’s definition of Mon’s 178.37 high as the latest smaller-degree corrective high and the minimum level this market now has to recoup to threaten a resumed bearish count. Peer such, this 178.37 level serves as our new short-term risk parameter from which a resumed bearish policy and exposure can be objectively rebased and managed by shorter-term traders with tighter risk profiles.
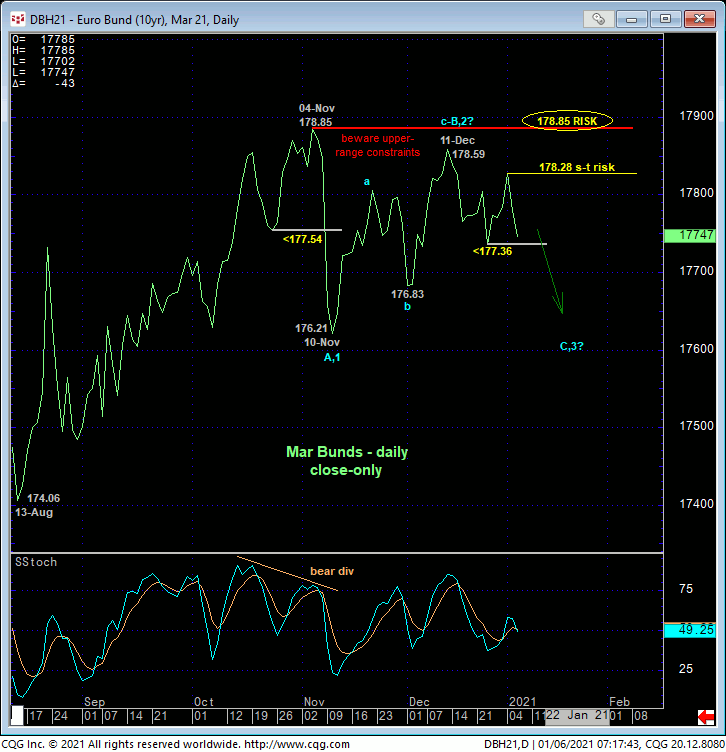
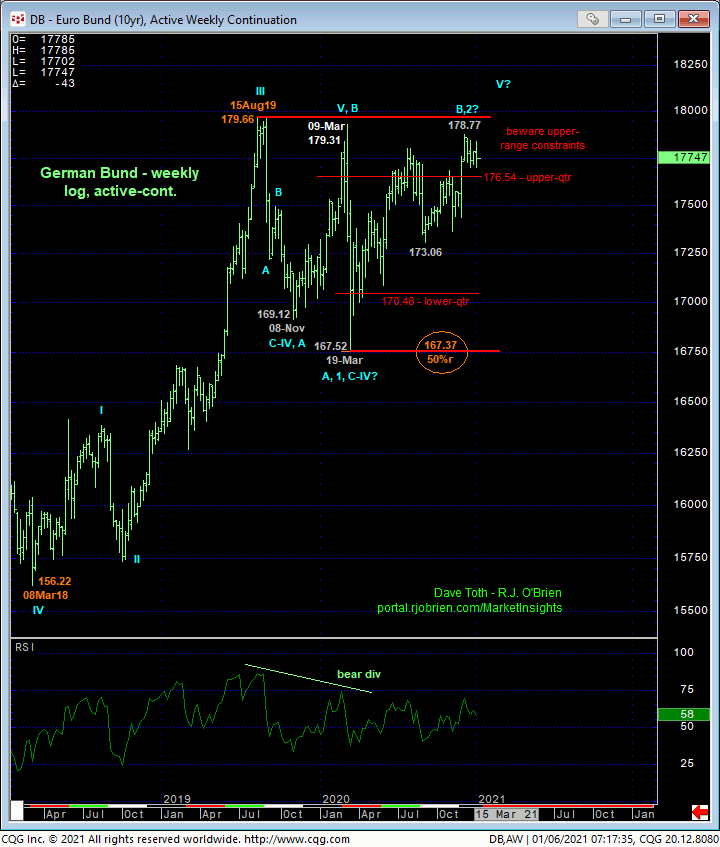
Yesterday and today’s short-term weakness comes against a longer-term backdrop that shows the market at the extreme upper recesses of not only the past couple months’ range on a daily close-only basis of the Mar contract above, but also the upper-quarter of the past 17-MONTH range where the risk/reward merits of a bullish policy are questionable at the very least. There’s no question that the merely lateral chop of the past two months is merely corrective ahead of an eventual resumption of 2020’s broader uptrend that preceded it. But as a result of today’s relapse, a recovery above 178.37 is now required to reinforce such a count, mitigate or defer a peak/reversal threat and re-expose the bull. Until and unless such 178.37+ strength is shown, there’s no way to know the market isn’t in the early stages of a (C- or 3rd-Wave) resumption of early-Nov’s initial (A- or 1st-Wave) within a major peak/correction/reversal process.
These issues considered, a bearish policy remains advised for long-term institutional players with a recovery above 04-Nov’s 178.85 high close and key risk parameter required to negate this call and warrant its cover. Shorter-term traders whipsawed by the past few weeks’ rangey volatility are advised to move to a neutral/sideline policy for the time being given the market’s position still within the throes of the past few weeks’ lateral chop where aimless whipsaw risk may persist. We will be watchful for further proof of labored, 3-wave corrective behavior on subsequent recovery attempts for a preferred risk/reward selling opportunity.
