JUN 10-Yr T-NOTES
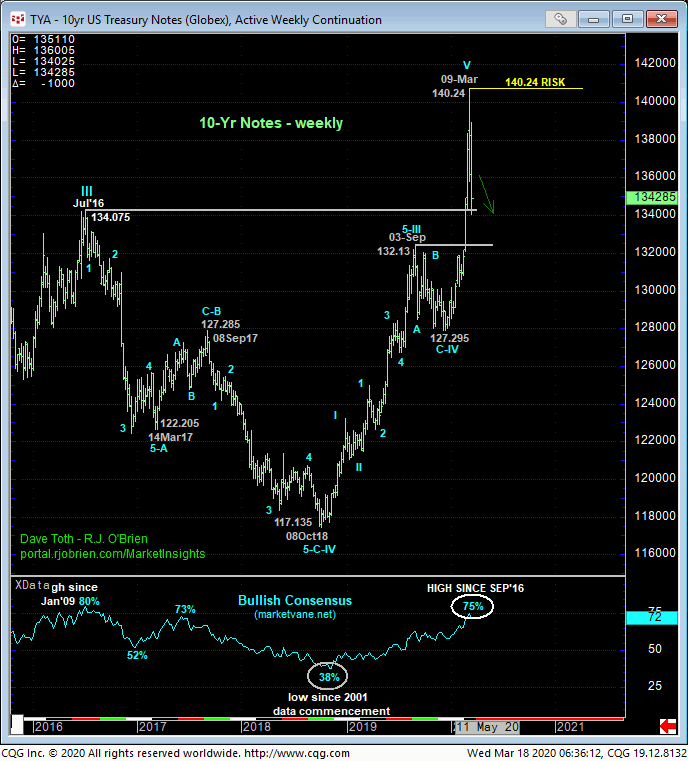
Yesterday’s relapse below Fri’s 135.255 initial counter-trend low provides the next bout of reinforcing evidence for our peak/reversal-threat count and cautious bearish policy from 137.00 OB recommended in Fri’s Trading Strategies Blog. This resumed weakness leaves smaller- and larger-degree corrective highs in its wake at 138.305 and 140.24, respectively, on an intra-day basis that now serve as our new short- and longer-term risk parameters from which a cautious bearish policy and exposure can be objectively rebased and managed.
Former lower-136-handle-area support would be expected to hold as new near-term resistance.
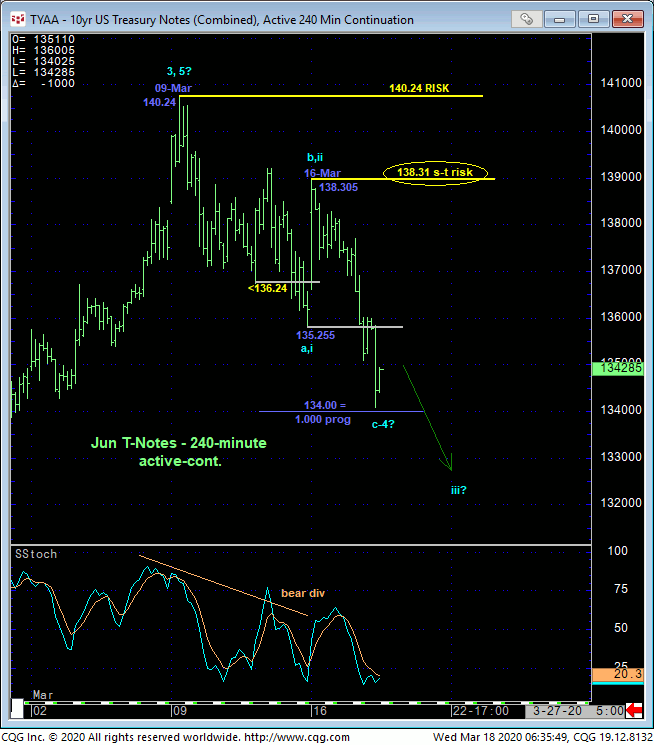
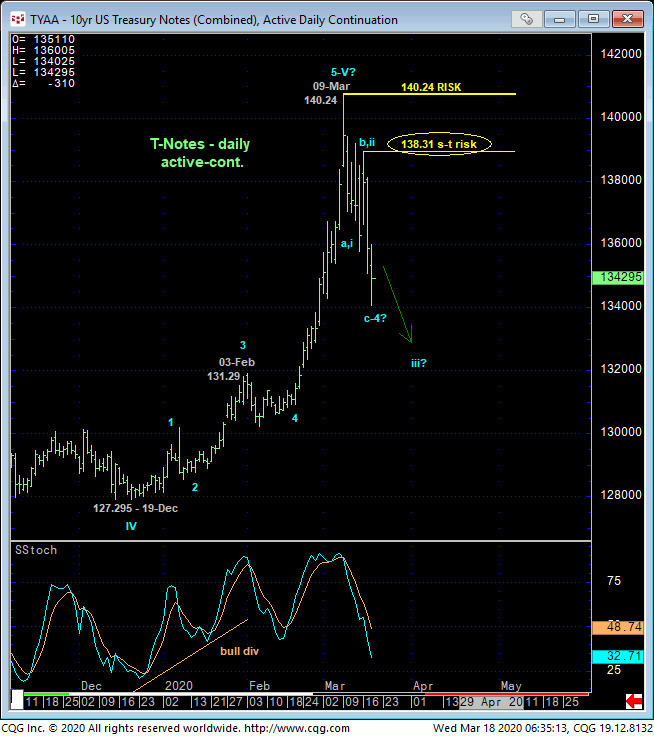
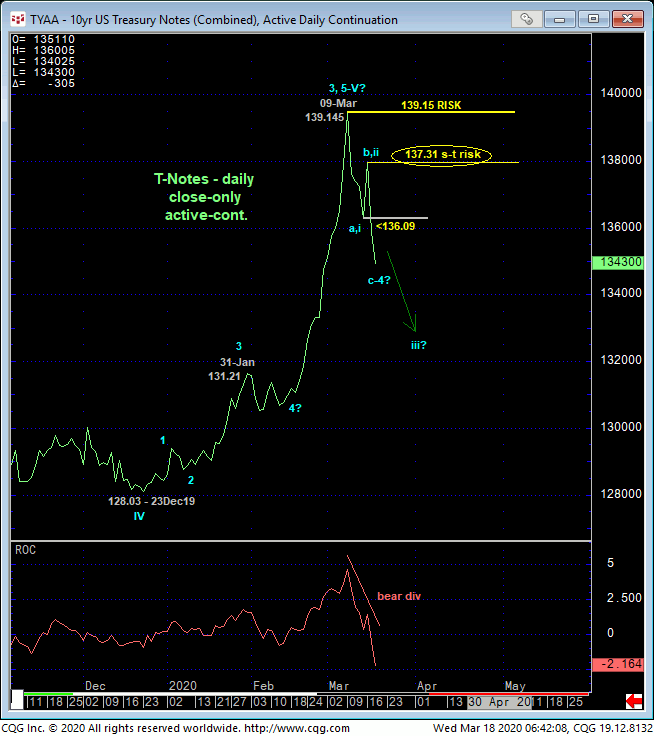
To be sure, relative to the magnitude of late-Feb/early-Mar’s steep, accelerated portion of the bull, the past week-and-a-half’s setback attempt still falls well within the bounds of a (4th-Wave) correction ahead of a final (5th-Wave) resumption of the bull. But if this is the case, then the market must stem the current decline with an intra-day recovery above 138.31 or a close above Mon’s 137.31 corrective high close required to render the sell-off attempt from 09-Mar’s high a 3-wave affair. Until and unless such strength is proven, there’s no way to know the decline from Mon’s high isn’t the dramatic 3rd-Wave of a reversal lower that could be historic in scope.
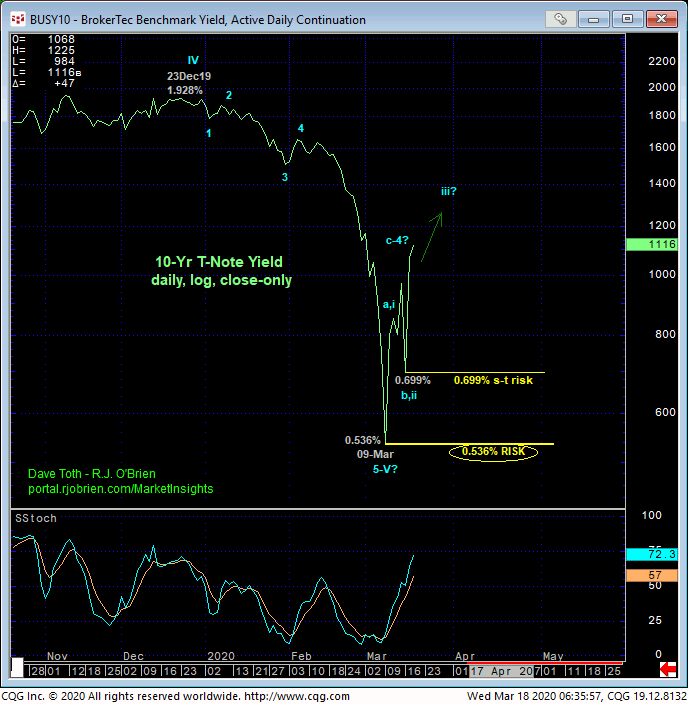
On a yield basis, the daily log close-only chart below shows the past couple days’ rate recovery identifying Mon’s 0.699% low as the latest smaller-degree corrective low and short-term but key risk parameter the market needs to relapse below to resurrect the secular downtrend in rates. Until at least such sub-0.699% weakness is shown, we cannot ignore the prospect of a base/reversal in rates that, again, could be historic given the recent drop in rates to levels that haven’t been seen in 80 years.
Finally, the weekly chart shows the scope of the resumed secular bull trend from Oct’18’s 117.135 low. Even though the market has dropped six handles since Mon, relative to the scope of the secular bull, it would clearly be premature to conclude a major top and reversal following proof of only a relatively minor setback. But again, IF the past couple days’ setback is just another correction within the secular bull, then the market must prove it be recovering above at least 138.31 on an intra-day basis or a close above 137.31. Until and unless the market satisfies this specific risk requirement, there’s no way to know this week’s decline isn’t the 3rd-Wave of a major reversal lower that would warn of steep, sustained losses straight away.
These issues considered, a cautious bearish policy and exposure from 137.00 OB recommended in Fri’s Trading Strategies Blog remain advised with an intra-day recovery above 138.31 or a close above 137.31 required to negate this count and warrant its cover ahead of a resumption of the secular bull. In lieu of such strength, further and possibly accelerated losses straight away should not surprise.
DEC20 EURODOLLARS
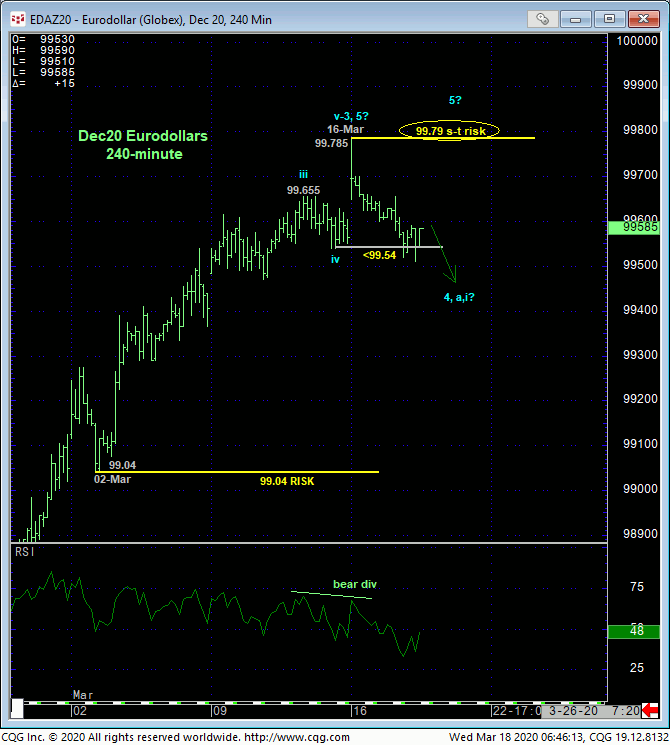
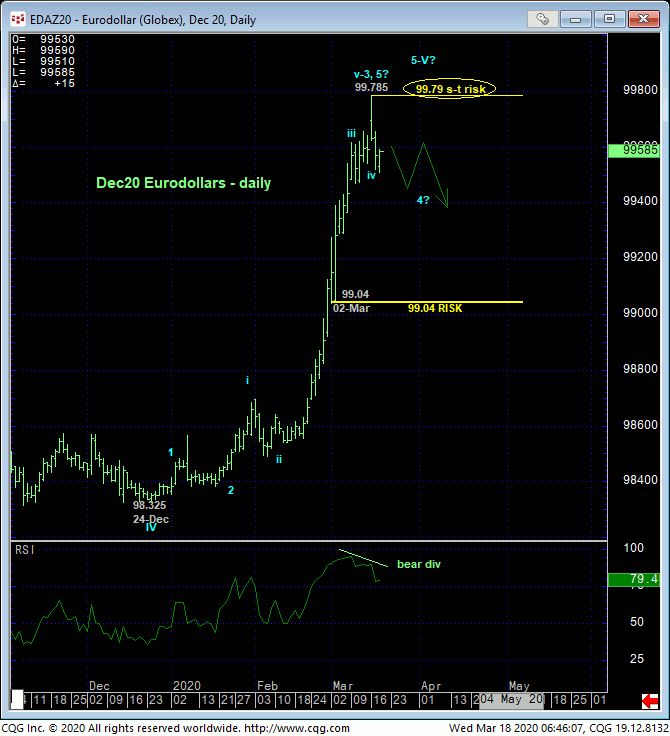
Yesterday afternoon’s slip below Fri’s 99.54 corrective low and short-term risk parameter discussed in yesterday morning’s Technical Blog confirms a bearish divergence in short-term momentum that defines Mon’s 99.785 high as one of developing importance and possibly the END of a major 5-wave Elliott sequence up from 24Dec19’s 98.325 low as labeled in the daily chart below. Per such, we’re identifying 99.79 as our new short-term but key risk parameter from which non-bullish decisions like long-covers and cautious bearish punts can now be objectively based and managed.
We’ll not pretend for a minute nor rely on the prospect that we know that the rally from late-Dec’s low to Mon’s high is a 3- or 5-wave structure. What we DO know as fact the bearish divergence in short-term mo cited above that highlights 99.785 and other markets’ recent concessions/peaks/reversals/corrections like T-notes, German bunds and gold. We also know that as a direct result of the massive extent of late-Feb/early-Mar’s rally that any “commensurately larger-degree” momentum failure needed to confirm a major peak is too far away (like to 02-Mar’s 99.04 corrective low) to be practical. Per such, we’re basically advising traders to exchange whipsaw risk (back above 99.79) for larger nominal risk and move t a cautious bearish policy until or unless Mon’s high is recouped.
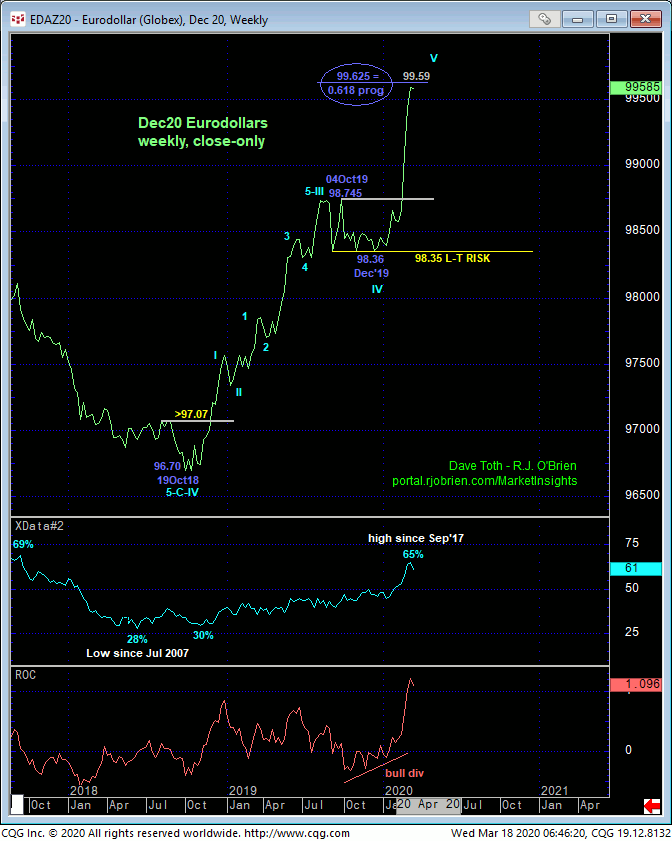
Contributing to a peak/reversal threat is the highest bullish sentiment we’ve seen in 2-1/2 years and the Fibonacci fact that the resumed secular bull from Dec’19’s 98.36 low on a weekly close-only basis below has spanned a length 61.8% (i.e. 0.618 progression) of Oct’18 -Oct’19’s preceding rally from 96.70 to 98.745.
Of course we cannot conclude a major peak and reversal from such a piddly, minor-degree momentum failure like yesterday’s. But given mounting ancillary evidence that questions the risk/reward merits of a continued bullish policy “up here”, traders are advised to move to a cautious bearish policy 99.66 ob with a recovery above 99.79 required to negate this specific call and warrant its cover ahead of a resumption of the secular bull. Until such 99.79+ strength is shown, we anticipate further lateral-to-lower prices in the period ahead.
