The first week of March saw an increase in volatility across multiple asset classes, with some significant sustained moves, including in the US Dollar and EURO.
In Fundamentals news, the global uncertainty triggered by the Coronavirus has continued to place stress on production, tourism, and general confidence. The global indices managed to hold their positions, but have not yet not recovered any significant value. The coming week could reveal how the markets view the remainder of March.
The US Dollar Index appeared to significantly reject the 100 level and may now begin to view moves further to the downside. There was a similar if inverted reaction with the EURO, now showing potential to climb higher in the coming week.
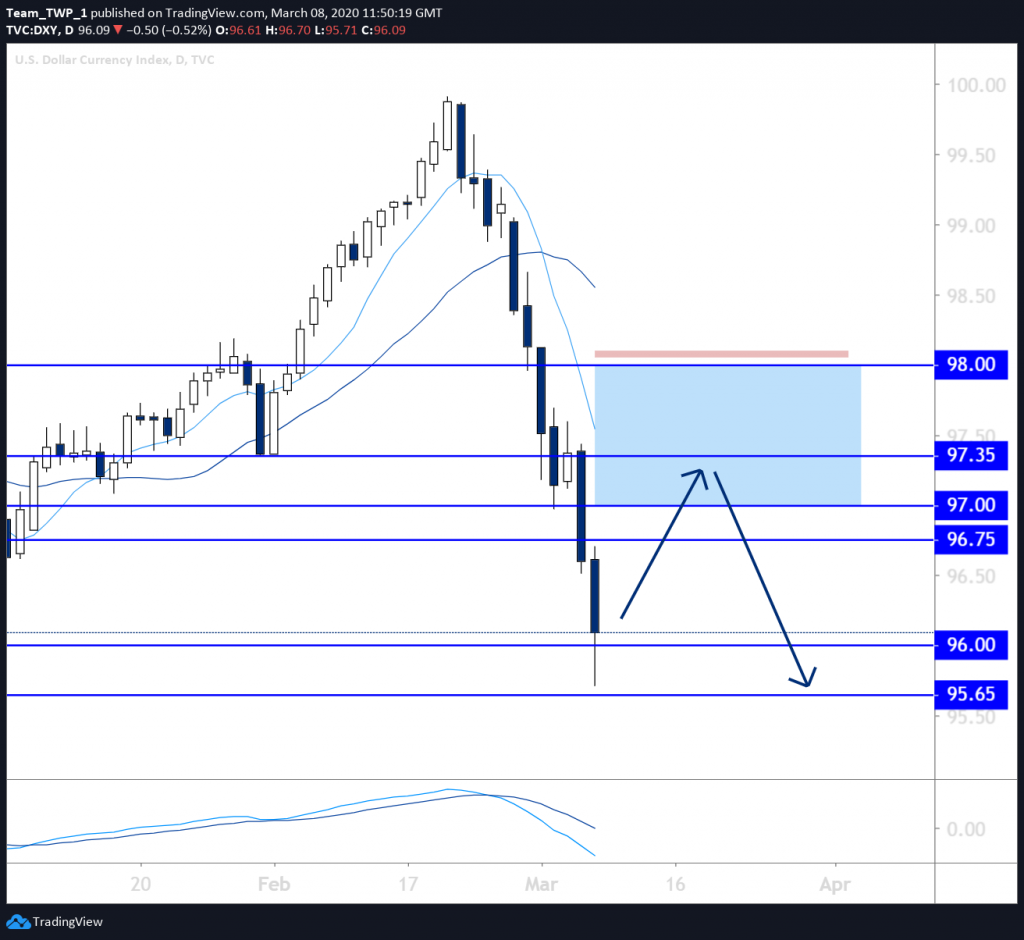
DXY, Bearish, Daily
The most notable observation in price action is the unusually large move to the downside, resulting in a break below the low of June in 2019.
Price action is now over-extended on the Daily timeframe to the downside, and a retracement back up into a level of technical resistance could offer an opportunity to join the trend if it resumes and heads even lower.
Levels that could act as resistance lie at or near 96.75, 97, 97.35 and then 98, with 98 being likely more in the case of a deep retracement.
Should price action form a small or small-medium bearish rejection candle up against one of these levels, combined with a Fibonacci measurement once the swing low has begun. And if this also overlaps near the moving averages (MAs), these could be signal that sellers are re-entering the market.
A stop-loss placed above the 98.00 level could offer additional technical stop-loss protection.
Should the trade be triggered, then taking partial profits is suggested as part of a management plan to mitigate risk.
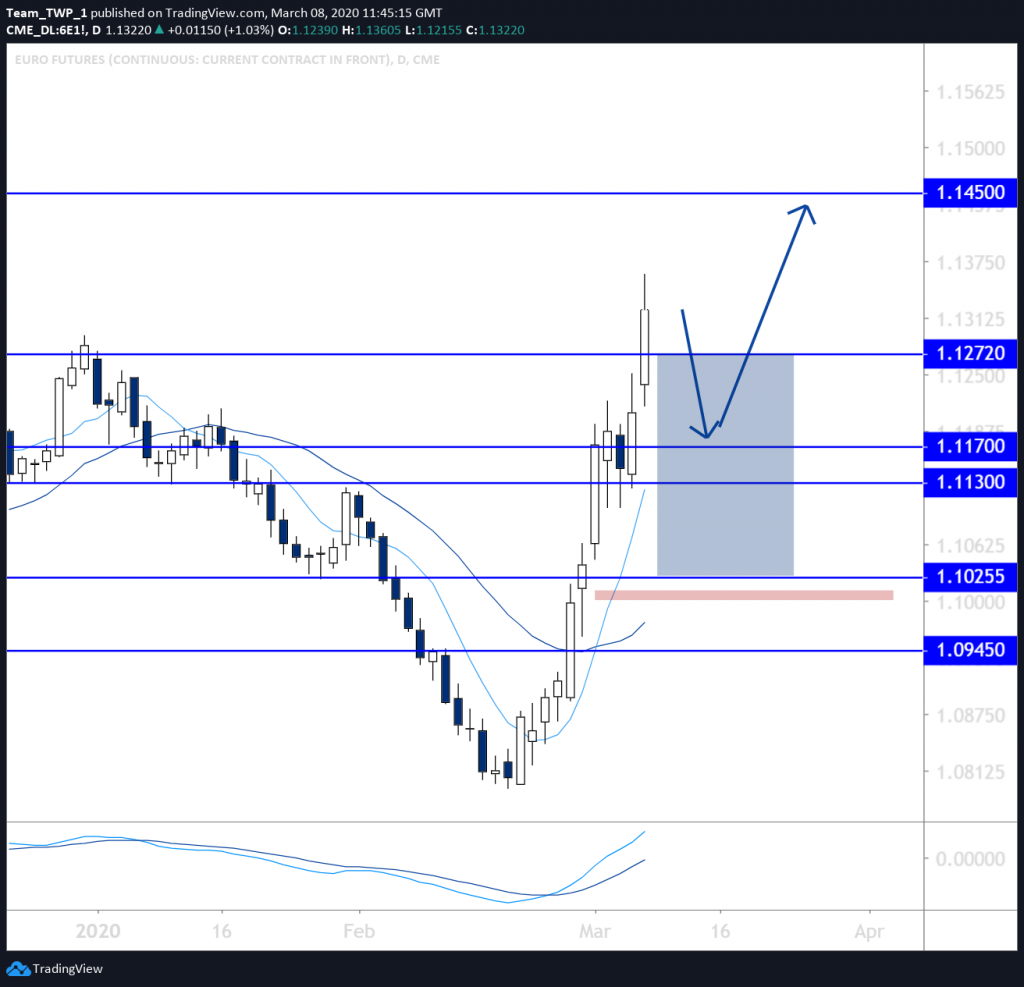
EURO, Daily, Bullish
Price action here has broken the high of December 2019 and appears to be moving aggressively towards 1.1450.
Price is also over-extended to the upside, after a brief consolidation holding above the 1.1130 level.
A retracement could find price returning to test levels at either 1.1025, 1.1130, 1.1170 or 1.1270, with 1.1025 being the deepest and lesser likely level.
If price action creates a bullish candlestick testing these levels, as well as a Fibonacci level within the MAs, an entry setup into the next move up may occur.
A stop-loss placed below the 1.1025 level may add additional technical protection.
And note that taking partial profits if price resumes and heads towards 1.1450 or higher could further mitigate risk.
Risk management will be key, so a stop-loss is imperative, in order to protect capital exposure against unforeseen outcomes.